


Next 24 hours: Everything except the Yen
Today’s report: Have we seen the extent of the Fed rate repricing?
Markets have been mostly consolidating recent moves into Thursday. We’ve seen some profit taking on Dollar longs and renewed demand for US equities into the dip. Whether or not this holds up is a completely different story.
Wake-up call
- priced in
- hot inflation
- USDJPYBOJ Noguchi out with dovish leaning speak
- labor market
- Oil pullback
- NZDUSD Sentiment recovery helps to bolster Kiwi
- next excuse
- Macro themes
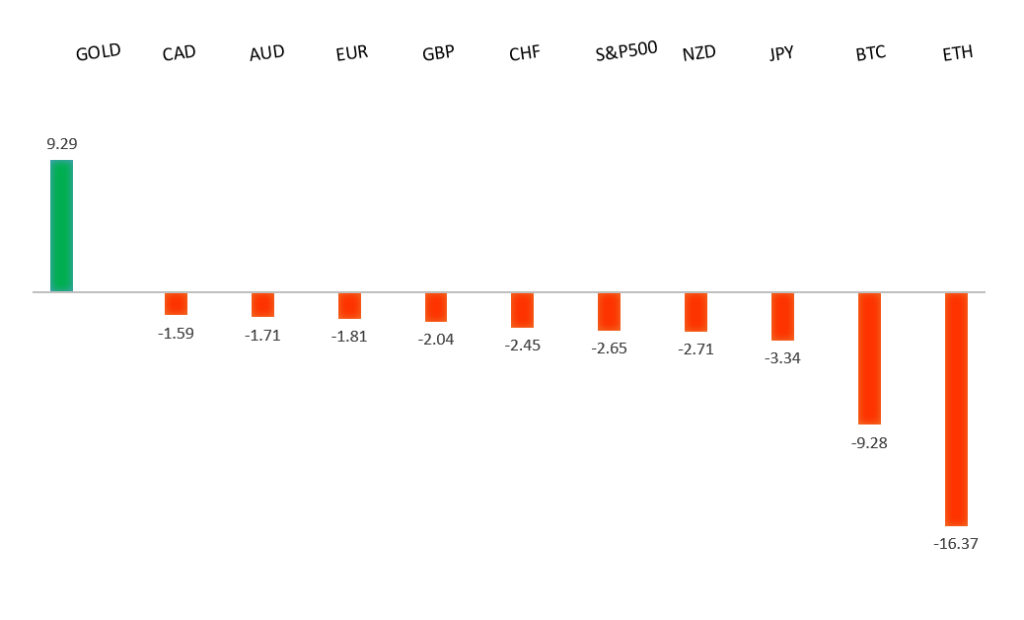
Peformance chart: 30-Day Performance vs. US dollar (%)
Suggested reading
- Inflation We Can Feel, That Perhaps We Don’t Measure, J, Hendrickson, AIER (April 16, 2024)
- Don't Worry, Volatility Is Part and Parcel of Bulls, Fisher Investments (April 16, 2024)
Chart talk: Technical & fundamental highlights
Choose pair:
EURUSD – technical overview
The Euro has been in a multi-month consolidation since bottoming out in 2022. Setbacks have since been exceptionally well supported on dips below 1.0500, with a higher platform sought out ahead of the next major upside extension. Look for a push through the 2023 high at 1.1276 to strengthen the constructive outlook and extend the recovery run towards 1.2000. Only back below 1.0400 negates.EURUSD – fundamental overview
There is a feeling into the latter half of the week that most of the US Dollar bullishness and Euro bearishness has been priced in, which has been contributing to the recovery in the single currency. Key standouts on Thursday’s calendar come from the Eurozone current account, Eurozone construction output, US initial jobless claims, the Philly Fed, existing home sales, and central bank speak.EURUSD - Technical charts in detail
GBPUSD – technical overview
Signs have emerged of the market wanting to put in a longer-term base after collapsing to a record low in September 2022. The latest push to a fresh 2024 high beyond 1.2830 confirms the outlook and opens the door for the next major upside extension towards the 2023 high at 1.3143. Any setbacks should now be well supported ahead of 1.2000.GBPUSD – fundamental overview
Tuesday's higher earnings in the UK jobs report was backed up by a hotter UK CPI print on Wednesday, which has helped to lend further support to the idea the BOE will be leaning more hawkish than not, which has supported the Pound. Key standouts on Thursday’s calendar come from the Eurozone current account, Eurozone construction output, US initial jobless claims, the Philly Fed, existing home sales, and central bank speak.USDJPY – technical overview
The market remains confined to a strong uptrend, most recently pushing through the multi-year high from 2022 at 151.95. This now opens the next major upside extension towards 155.00. Key support comes in at 150.00, with only a weekly close below to delay the constructive outlook.USDJPY – fundamental overview
BOJ Board member Noguchi was out earlier today talking about policy leaning more accommodative and the central bank taking its time to raise rates gradually, while not following other central banks. At the same time, Vice Minister of Finance for International Affairs Kanda stressed the stance adopted by the authorities had not changed and that officials were ready to take appropriate action on FX when necessary. Key standouts on Thursday’s calendar come from the Eurozone current account, Eurozone construction output, US initial jobless claims, the Philly Fed, existing home sales, and central bank speak.AUDUSD – technical overview
There are signs of the potential formation of a longer-term base with the market trading down into a meaningful longer-term support zone. Only a monthly close below 0.6200 would give reason for rethink. Back above 0.6900 will take the big picture pressure off the downside and strengthen case for a bottom.AUDUSD – fundamental overview
The Australian Dollar recovery is holding up decently on Thursday, with the market focusing on the positives out of the Aussie employment report which show a relatively tight labor market. Key standouts on Thursday’s calendar come from the Eurozone current account, Eurozone construction output, US initial jobless claims, the Philly Fed, existing home sales, and central bank speak.USDCAD – technical overview
Above 1.3000 signals an end to a period of longer-term bearish consolidation and suggests the market is in the process of carving out a more significant longer-term base. Next key resistance now comes in up into the 1.4000 area. Setbacks should be very well supported down into the 1.3000 area.USDCAD – fundamental overview
The Canadian Dollar is mounting a recovery from yearly lows on the back of broad based US Dollar selling and demand for US equities. At the same time, recent soft Canada inflation data and a sharp pullback in the price of oil should keep the Loonie from wanting to run too far. Key standouts on Thursday’s calendar come from the Eurozone current account, Eurozone construction output, US initial jobless claims, the Philly Fed, existing home sales, and central bank speak.NZDUSD – technical overview
Overall pressure remains on the downside with the market continuing to stall out on runs up into the 0.6500 area. At the same time, there are some signs of the market wanting to put in a longer-term base. Ultimately, a break back above 0.6500 would be required to take the medium-term pressure off the downside and encourage this prospect. A monthly close below 0.5800 will intensify bearish price action.NZDUSD – fundamental overview
Absence of first tier data out of New Zealand has the New Zealand Dollar following its Aussie cousin higher, while also tracking higher as currencies recovery across the board against the Buck and US equity futures turn up. Key standouts on Thursday’s calendar come from the Eurozone current account, Eurozone construction output, US initial jobless claims, the Philly Fed, existing home sales, and central bank speak.US SPX 500 – technical overview
Longer-term technical studies continue to look quite extended after pushing to fresh record highs, begging for a deeper correction ahead. Look for rallies to be well capped in favor of lower tops and lower lows. Next key support comes in at 4921.US SPX 500 – fundamental overview
Though we have seen an adjustment of investor expectations towards the amount of rate cuts in 2024, the market still hopes policy will end up erring more towards the investor friendly, accommodative side of things. This bet has kept stocks well bid into dips and consistently pushing record highs.GOLD (SPOT) – technical overview
The 2019 breakout above the 2016 high at 1375 was a significant development, opening the door for fresh record highs. Setbacks should now be well supported above 1900 on a monthly close basis ahead of the next major upside extension towards 2500.GOLD (SPOT) – fundamental overview
The yellow metal has pushed record highs in 2024 with solid demand from medium and longer-term accounts. These players are more concerned about inflation risk and a less upbeat global growth outlook. All of this should keep the commodity well supported, with many market participants also fleeing to the hard asset as the grand dichotomy of record high equities and record low yields comes to an end.