


Next 24 hours: Trying to figure out the next move
Today’s report: Momentum swinging back to risk assets
As the week got going, we talked about the possibility that a lot of the Dollar bullishness and equity market bearishness may have been priced to the max, leaving room for a healthy reversal of flow. And indeed, this is how things have been playing out.
Wake-up call
- PMI readings
- Gilts lead
- intervention levels
- Aussie inflation
- USDCAD Oil stabilizes, stocks recover
- trade surplus
- inflation outlook
- Macro themes
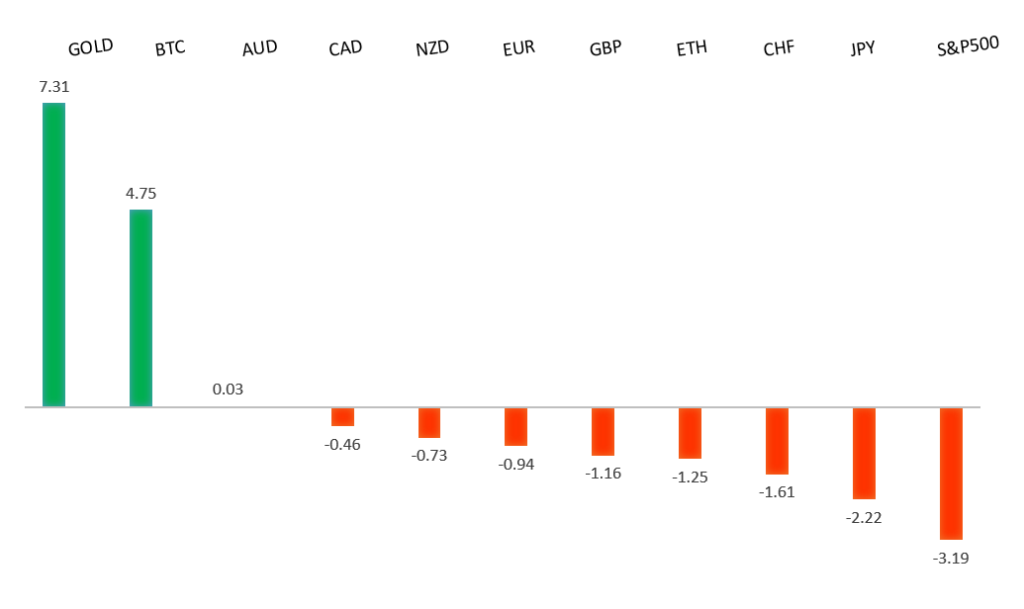
Peformance chart: 30-Day Performance vs. US dollar (%)
Suggested reading
- Yes, It Is Painfully Normal To Not Make Money, J, Calhoun, Alhambra (April 21, 2024)
- Strong Dollar False Fears Are Back, and Overdone, Fisher Investments (April 22, 2024)
Chart talk: Technical & fundamental highlights
Choose pair:
EURUSD – technical overview
The Euro has been in a multi-month consolidation since bottoming out in 2022. Setbacks have since been exceptionally well supported on dips below 1.0500, with a higher platform sought out ahead of the next major upside extension. Look for a push through the 2023 high at 1.1276 to strengthen the constructive outlook and extend the recovery run towards 1.2000. Only back below 1.0400 negates.EURUSD – fundamental overview
The Euro has been better bid of late, getting a nice boost from a round of better than expected PMI reads out of the Eurozone, Germany and France. Key standouts on Wednesday’s calendar come from German Ifo reads, UK CBI data, Canada retail sales, US durable goods, and the Bank of Canada Summary of Deliberations.EURUSD - Technical charts in detail
GBPUSD – technical overview
Signs have emerged of the market wanting to put in a longer-term base after collapsing to a record low in September 2022. The latest push to a fresh 2024 high beyond 1.2830 confirms the outlook and opens the door for the next major upside extension towards the 2023 high at 1.3143. Any setbacks should now be well supported ahead of 1.2000.GBPUSD – fundamental overview
Gilts have been leading European bond yields higher and the Pound has been getting an extra boost on the back of some impressive UK PMI reads. Key standouts on Wednesday’s calendar come from German Ifo reads, UK CBI data, Canada retail sales, US durable goods, and the Bank of Canada Summary of Deliberations.USDJPY – technical overview
The market remains confined to a strong uptrend, most recently pushing through the multi-year high from 2022 at 151.95. This now opens the next major upside extension towards 155.00. Key support comes in at 150.00, with only a weekly close below to delay the constructive outlook.USDJPY – fundamental overview
Monetary policy divergence continues to be a major driver of Yen weakness and though the market has been threatened with possible intervention, this has only slowed the pace of Yen declines rather than effectuating any major reversal. There will be a lot of focus on this week's Japan CPI data and BOJ policy decision. Former Forex Chief Furusawa said he expects authorities to step into the market by 160.00 at the latest. Key standouts on Wednesday’s calendar come from German Ifo reads, UK CBI data, Canada retail sales, US durable goods, and the Bank of Canada Summary of Deliberations.AUDUSD – technical overview
There are signs of the potential formation of a longer-term base with the market trading down into a meaningful longer-term support zone. Only a monthly close below 0.6200 would give reason for rethink. Back above 0.6900 will take the big picture pressure off the downside and strengthen case for a bottom.AUDUSD – fundamental overview
The Australian Dollar is performing well on Wednesday after Aussie CPI data came in hotter than expected. Key standouts on Wednesday’s calendar come from German Ifo reads, UK CBI data, Canada retail sales, US durable goods, and the Bank of Canada Summary of Deliberations.USDCAD – technical overview
Above 1.3000 signals an end to a period of longer-term bearish consolidation and suggests the market is in the process of carving out a more significant longer-term base. Next key resistance now comes in up into the 1.4000 area. Setbacks should be very well supported down into the 1.3000 area.USDCAD – fundamental overview
Some stabilization in the price of oil following last week's intense drop, and a concurrent recovery in global sentiment have helped to encourage a moderate rebound in the Canadian Dollar. Key standouts on Wednesday’s calendar come from German Ifo reads, UK CBI data, Canada retail sales, US durable goods, and the Bank of Canada Summary of Deliberations.NZDUSD – technical overview
Overall pressure remains on the downside with the market continuing to stall out on runs up into the 0.6500 area. At the same time, there are some signs of the market wanting to put in a longer-term base. Ultimately, a break back above 0.6500 would be required to take the medium-term pressure off the downside and encourage this prospect. A monthly close below 0.5800 will intensify bearish price action.NZDUSD – fundamental overview
The New Zealand Dollar has managed to find some additional bids in recent trade on the back of the latest data that shows New Zealand recording the first trade surplus in ten months. Key standouts on Wednesday’s calendar come from German Ifo reads, UK CBI data, Canada retail sales, US durable goods, and the Bank of Canada Summary of Deliberations.US SPX 500 – technical overview
Longer-term technical studies continue to look quite extended after pushing to fresh record highs, begging for a deeper correction ahead. Look for rallies to be well capped in favor of lower tops and lower lows. Next key support comes in at 4921.US SPX 500 – fundamental overview
Though we have seen a healthy adjustment of investor expectations towards the amount of rate cuts in 2024, the market still hopes policy will end up erring more towards the investor friendly, accommodative side of things. This bet has kept stocks well bid into dips and consistently pushing record highs. The trouble right now is that inflation has been showing signs of ticking back up, all while the market contends with additional uncertainty around geopolitical risk.GOLD (SPOT) – technical overview
The 2019 breakout above the 2016 high at 1375 was a significant development, opening the door for fresh record highs. Setbacks should now be well supported above 1900 on a monthly close basis ahead of the next major upside extension towards 2500.GOLD (SPOT) – fundamental overview
The yellow metal has pushed record highs in 2024 with solid demand from medium and longer-term accounts. These players are more concerned about inflation, geopolitical risk and a less upbeat global growth outlook. All of this should keep the commodity well supported, with many market participants also fleeing to the hard asset as the grand dichotomy of record high equities and record low yields comes to an end.