


Next 24 hours: Still feeling things out post Fed decision
Today’s report: Investors find silver lining in Fed decision
In our Wednesday special report previewing the Fed policy decision, we highlighted the fact that the extent of the pricing in of scaled back Fed cuts had been so extreme that the balance of risk heading into the decision had been leaning towards a reaction of US Dollar selling and risk on flow.
Wake-up call
- manufacturing PMIs
- Dollar fundamentals
- BOJ Minutes
- RBA Kearns
- Canada trade
- RBNZ Hawkesby
- inflation outlook
- Macro themes
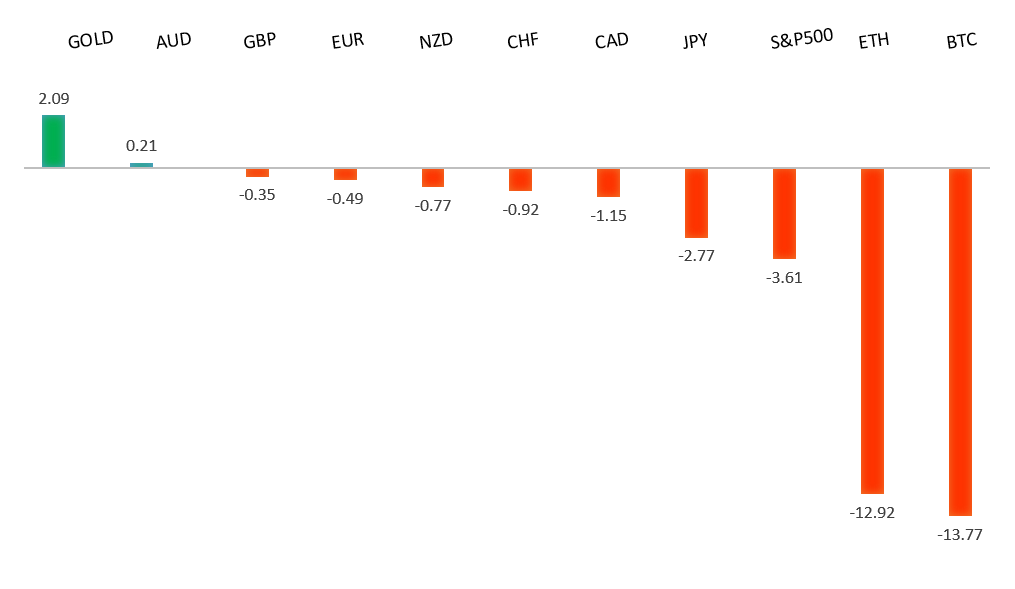
Peformance chart: 30-Day Performance vs. US dollar (%)
Suggested reading
- Can Kinder Capitalism Compete in Ruthless Retail, J. Sinclair, Financial Times (May 2, 2024)
- The Fun Part of "Crypto Cycle," Where Money Is Made, S. McBride, Risk Hedge (April 28, 2024)
Chart talk: Technical & fundamental highlights
Choose pair:
EURUSD – technical overview
The Euro has been in a multi-month consolidation since bottoming out in 2022. Setbacks have since been exceptionally well supported on dips below 1.0500, with a higher platform sought out ahead of the next major upside extension. Look for a push through the 2023 high at 1.1276 to strengthen the constructive outlook and extend the recovery run towards 1.2000. Only back below 1.0400 negates.EURUSD – fundamental overview
The Euro has been mostly moving on US fundamentals in recent sessions, with the single currency better bid post a Fed decision in which the central bank announced it would be starting to reduce the pace of quantitative tightening in June. Key standouts on Thursday’s calendar come from German and Eurozone manufacturing PMIs, Canada trade, US trade, US initial jobless claims, and US factory orders.EURUSD - Technical charts in detail
GBPUSD – technical overview
Signs have emerged of the market wanting to put in a longer-term base after collapsing to a record low in September 2022. The latest push to a fresh 2024 high beyond 1.2830 confirms the outlook and opens the door for the next major upside extension towards the 2023 high at 1.3143. Any setbacks should now be well supported ahead of 1.2000.GBPUSD – fundamental overview
The Pound has been mostly moving on US fundamentals in recent sessions, with the single currency better bid post a Fed decision in which the central bank announced it would be starting to reduce the pace of quantitative tightening in June. Key standouts on Thursday’s calendar come from German and Eurozone manufacturing PMIs, Canada trade, US trade, US initial jobless claims, and US factory orders.USDJPY – technical overview
The market remains confined to a strong uptrend, most recently extending to a multi-year high through 160.00. Key support comes in at 151.95, with only a weekly close below to delay the constructive outlook.USDJPY – fundamental overview
Officials continue to keep the market in the dark with respect to offering any details about intervention. Meanwhile, the BOJ released its latest Minutes in which some members highlighted the need to provide a clearer and more thorough communication that the scrapping of NIRP and YCC did not mean the start to a monetary policy tightening cycle. Key standouts on Thursday’s calendar come from German and Eurozone manufacturing PMIs, Canada trade, US trade, US initial jobless claims, and US factory orders.AUDUSD – technical overview
There are signs of the potential formation of a longer-term base with the market trading down into a meaningful longer-term support zone. Only a monthly close below 0.6200 would give reason for rethink. Back above 0.6900 will take the big picture pressure off the downside and strengthen case for a bottom.AUDUSD – fundamental overview
Former Head of Domestic Markets at the RBA Kearns was out with hawkish comments, saying the RBA had been far too timid in raising rates. On the data side, Aussie dwelling approvals were a miss, while Aussie trade data showed the surplus narrowing against expectation. Key standouts on Thursday’s calendar come from German and Eurozone manufacturing PMIs, Canada trade, US trade, US initial jobless claims, and US factory orders.USDCAD – technical overview
Above 1.3000 signals an end to a period of longer-term bearish consolidation and suggests the market is in the process of carving out a more significant longer-term base. Next key resistance now comes in up into the 1.4000 area. Setbacks should be very well supported down into the 1.3000 area.USDCAD – fundamental overview
The Canadian Dollar has been recovering on the back of broad based US Dollar selling post the latest Fed decision. However, rallies have been mild on account of softer Canada economic data as reflected through recent GDP and manufacturing PMIs, and on account of a slide in the price of oil. Key standouts on Thursday’s calendar come from German and Eurozone manufacturing PMIs, Canada trade, US trade, US initial jobless claims, and US factory orders.NZDUSD – technical overview
Overall pressure remains on the downside with the market continuing to stall out on runs up into the 0.6500 area. At the same time, there are some signs of the market wanting to put in a longer-term base. Ultimately, a break back above 0.6500 would be required to take the medium-term pressure off the downside and encourage this prospect. A monthly close below 0.5800 will intensify bearish price action.NZDUSD – fundamental overview
RBNZ Governor Orr and Deputy Governor Hawkesby spoke earlier in the session before a parliamentary committee as part of their scheduled Financial Stability Report briefing. Hawkesby said that while there had been an increase in the proportion of non-performing loans, this had been "largely as predicted six months ago," and "provisions hadn't risen or weren't projected to rise as far as they had." On the data front, New Zealand building permits were balanced on the whole. Key standouts on Thursday’s calendar come from German and Eurozone manufacturing PMIs, Canada trade, US trade, US initial jobless claims, and US factory orders.US SPX 500 – technical overview
Longer-term technical studies continue to look quite extended after pushing to fresh record highs, begging for a deeper correction ahead. Look for rallies to be well capped in favor of lower tops and lower lows. Next key support comes in at 4921.US SPX 500 – fundamental overview
Though we have seen a healthy adjustment of investor expectations towards the amount of rate cuts in 2024, the market still hopes policy will end up erring more towards the investor friendly, accommodative side of things. This bet has kept stocks well bid into dips and consistently pushing record highs. The trouble right now is that inflation has been showing signs of ticking back up, all while the market contends with additional uncertainty around geopolitical risk.GOLD (SPOT) – technical overview
The 2019 breakout above the 2016 high at 1375 was a significant development, opening the door for fresh record highs. Setbacks should now be well supported above 1900 on a monthly close basis ahead of the next major upside extension towards 2500.GOLD (SPOT) – fundamental overview
The yellow metal has pushed record highs in 2024 with solid demand from medium and longer-term accounts. These players are more concerned about inflation, geopolitical risk and a less upbeat global growth outlook. All of this should keep the commodity well supported, with many market participants also fleeing to the hard asset as the grand dichotomy of record high equities and record low yields comes to an end.