


Next 24 hours: The start to a fresh easing cycle?
Today’s report: Study central bank moves
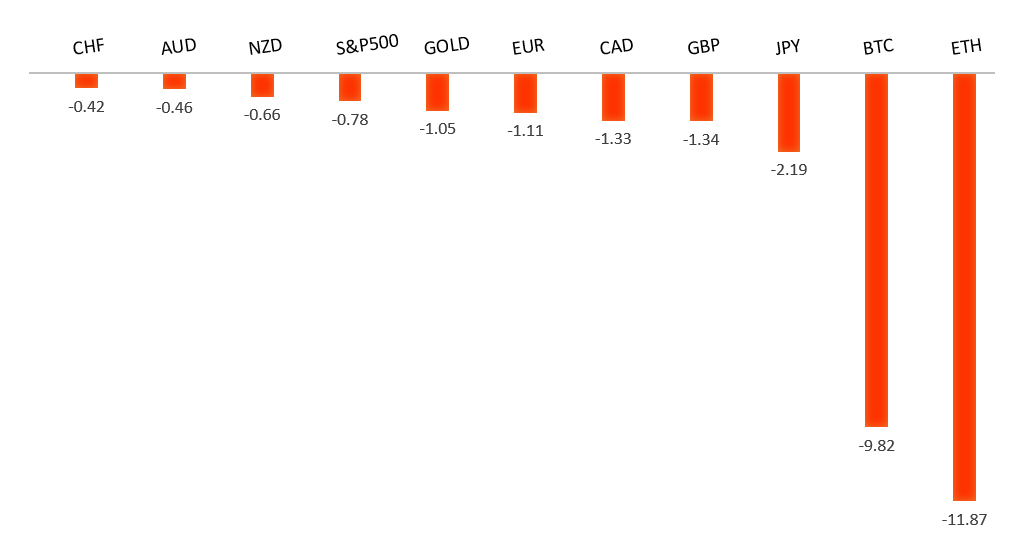
US equities remain well in demand into the mid-week, though we have seen a bit of a disconnect in price action when it comes to the FX market, where currencies are back under pressure against the Buck.
Wake-up call
- June cut
- August cut
- Ueda comments
- less hawkish
- strong data
- GDT auction
- inflation outlook
- Macro themes
Peformance chart: 30-Day Performance vs. US dollar (%)
Suggested reading
- How Ridiculous To Parse Jerome Powell's Words, J. Calhoun, Alhambra (May 5, 2024)
- The SEC's Climate Rule Is Lose-Lose For U.S. Companies, T. Johnston, Examiner (May 6, 2024)
Chart talk: Technical & fundamental highlights
Choose pair:
EURUSD – technical overview
The Euro has been in a multi-month consolidation since bottoming out in 2022. Setbacks have since been exceptionally well supported on dips below 1.0500, with a higher platform sought out ahead of the next major upside extension. Look for a push through the 2023 high at 1.1276 to strengthen the constructive outlook and extend the recovery run towards 1.2000. Only back below 1.0400 negates.EURUSD – fundamental overview
The Euro has come back under pressure in recent sessions, weighed down by increasing expectations of more dovishness at the ECB. The market is now talking about a June rate cut after a number of ECB officials have been out calling for three ECB cuts in 2024. Looking ahead, Wednesday’s calendar is rather light, with only German industrial production and some Fed speak standing out.EURUSD - Technical charts in detail
GBPUSD – technical overview
Signs have emerged of the market wanting to put in a longer-term base after collapsing to a record low in September 2022. The latest push to a fresh 2024 high beyond 1.2830 confirms the outlook and opens the door for the next major upside extension towards the 2023 high at 1.3143. Any setbacks should now be well supported ahead of 1.2000.GBPUSD – fundamental overview
The Pound has been in sell mode as the OIS market prices a near certain full BOE rate cut at the August meeting, up from about 80% odds earlier last week. Looking ahead, Wednesday’s calendar is rather light, with only German industrial production and some Fed speak standing out.USDJPY – technical overview
The market remains confined to a strong uptrend, most recently extending to a multi-year high through 160.00. Key support comes in at 151.95, with only a weekly close below to delay the constructive outlook.USDJPY – fundamental overview
BOJ Ueda comments seem to be falling on deaf ears, with the Yen continuing to slide despite his warnings the BOJ could enact a monetary policy response on FX related considerations. In the end, the market isn't going to be too scared away from selling Yen unless there is some real action. Looking ahead, Wednesday’s calendar is rather light, with only German industrial production and some Fed speak standing out.AUDUSD – technical overview
There are signs of the potential formation of a longer-term base with the market trading down into a meaningful longer-term support zone. Only a monthly close below 0.6200 would give reason for rethink. Back above 0.6900 will take the big picture pressure off the downside and strengthen case for a bottom.AUDUSD – fundamental overview
The Australian Dollar has been tracking lower since yesterday's RBA meeting in which the central bank left rates on hold and leaned more neutral and less hawkish than what many were expecting. Softer Aussie retail sales and broad based demand for the US Dollar have also factored into flow. Looking ahead, Wednesday’s calendar is rather light, with only German industrial production and some Fed speak standing out.USDCAD – technical overview
Above 1.3000 signals an end to a period of longer-term bearish consolidation and suggests the market is in the process of carving out a more significant longer-term base. Next key resistance now comes in up into the 1.4000 area. Setbacks should be very well supported down into the 1.3000 area.USDCAD – fundamental overview
The Canadian Dollar was less interested in a strong Canada Ivey PMI print on Tuesday, instead more concerned about ongoing weakness in the price of oil and renewed, broad based US Dollar demand. Looking ahead, Wednesday’s calendar is rather light, with only German industrial production and some Fed speak standing out.NZDUSD – technical overview
Overall pressure remains on the downside with the market continuing to stall out on runs up into the 0.6500 area. At the same time, there are some signs of the market wanting to put in a longer-term base. Ultimately, a break back above 0.6500 would be required to take the medium-term pressure off the downside and encourage this prospect. A monthly close below 0.5800 will intensify bearish price action.NZDUSD – fundamental overview
Tuesday's GDT auction results came in stronger than expected and have helped the New Zealand Dollar to hold up relatively well into the latest round of setbacks brought on by broad based US Dollar demand. Looking ahead, Wednesday’s calendar is rather light, with only German industrial production and some Fed speak standing out.US SPX 500 – technical overview
Longer-term technical studies continue to look quite extended after pushing to fresh record highs, begging for a deeper correction ahead. Look for rallies to be well capped in favor of lower tops and lower lows. Next key support comes in at 4921.US SPX 500 – fundamental overview
Though we have seen a healthy adjustment of investor expectations towards the amount of rate cuts in 2024, the market still hopes policy will end up erring more towards the investor friendly, accommodative side of things. This bet has kept stocks well bid into dips and consistently pushing record highs. The trouble right now is that inflation has been showing signs of ticking back up, all while the market contends with additional uncertainty around geopolitical risk.GOLD (SPOT) – technical overview
The 2019 breakout above the 2016 high at 1375 was a significant development, opening the door for fresh record highs. Setbacks should now be well supported above 1900 on a monthly close basis ahead of the next major upside extension towards 2500.GOLD (SPOT) – fundamental overview
The yellow metal has pushed record highs in 2024 with solid demand from medium and longer-term accounts. These players are more concerned about inflation, geopolitical risk and a less upbeat global growth outlook. All of this should keep the commodity well supported, with many market participants also fleeing to the hard asset as the grand dichotomy of record high equities and record low yields comes to an end.