


Next 24 hours: All eyes on US CPI release
Today’s report: Strange reaction to hot US inflation data
We’re a little surprised to see how the market has been trading over the past 24 hours when considering the result of the US producer prices print. Producer prices doubled forecasts to suggest inflation is back on the rise.
Wake-up call
- German ZEW
- unemployment rises
- Thursday GDP
- China proposal
- wholesale sales
- macro flows
- inflation outlook
- Macro themes
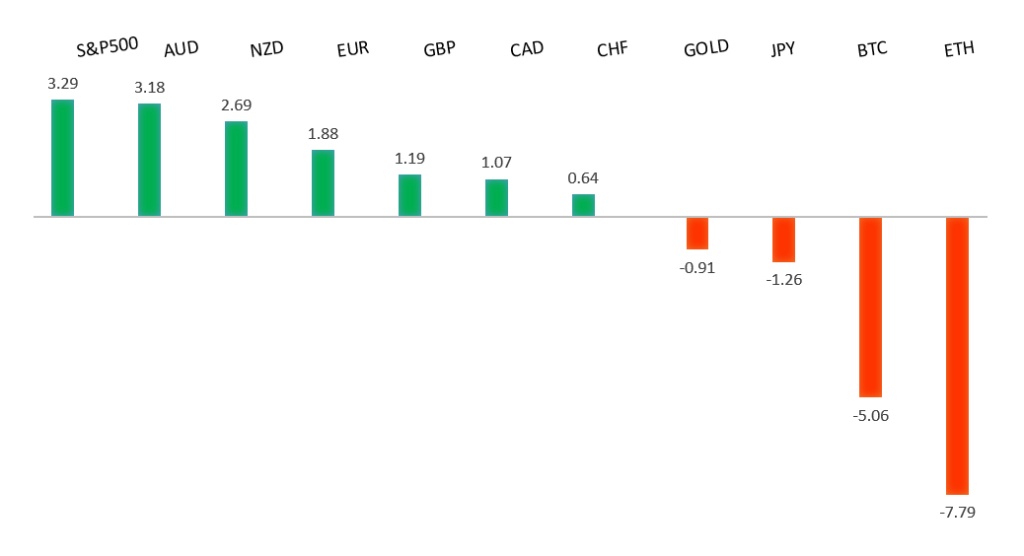
Peformance chart: 30-Day Performance vs. US dollar (%)
Suggested reading
- The Better Lesson To Take From Blind Stock Picks, Fisher Investments (May 13, 2024)
- How a Bunch of Redditors Made the Shares of GameStop Soar, E. Stewart, Vox (May 13, 2024)
Chart talk: Technical & fundamental highlights
Choose pair:
EURUSD – technical overview
The Euro has been in a multi-month consolidation since bottoming out in 2022. Setbacks have since been exceptionally well supported on dips below 1.0500, with a higher platform sought out ahead of the next major upside extension. Look for a push through the 2023 high at 1.1276 to strengthen the constructive outlook and extend the recovery run towards 1.2000. Only back below 1.0400 negates.EURUSD – fundamental overview
The Euro got some help from Tuesday's surprise German ZEW report which came in at 47.1 from 42.9 previous. The idea that most of the downside for the Euro has been priced also continues to make the rounds. Key standouts on Wednesday’s calendar include Eurozone employment, Eurozone industrial production, Canada housing starts, US CPI, US retail sales, New York empire manufacturing, US business inventories, NAHB housing, and Fed speak.EURUSD - Technical charts in detail
GBPUSD – technical overview
Signs have emerged of the market wanting to put in a longer-term base after collapsing to a record low in September 2022. The latest push to a fresh 2024 high beyond 1.2830 confirms the outlook and opens the door for the next major upside extension towards the 2023 high at 1.3143. Any setbacks should now be well supported ahead of 1.2000.GBPUSD – fundamental overview
The Pound has held up well on account of broad based US Dollar selling, but has underperformed relative to other currencies after Tuesday's UK employment data produced and unsettling mix. Odds for a June rate cut from the BOE sit at about 55%. Key standouts on Wednesday’s calendar include Eurozone employment, Eurozone industrial production, Canada housing starts, US CPI, US retail sales, New York empire manufacturing, US business inventories, NAHB housing, and Fed speak.USDJPY – technical overview
The market remains confined to a strong uptrend, most recently extending to a multi-year high through 160.00. Key support comes in at 151.95, with only a weekly close below to delay the constructive outlook.USDJPY – fundamental overview
The major pair has been trading with a more reserved tone in recent sessions, presumably as traders proceed with caution ahead of tomorrow's Q1 Japan GDP data. There is a worry the data could lean to the soft side and derail the BOJ's path towards a tightening of monetary policy. Key standouts on Wednesday’s calendar include Eurozone employment, Eurozone industrial production, Canada housing starts, US CPI, US retail sales, New York empire manufacturing, US business inventories, NAHB housing, and Fed speak.AUDUSD – technical overview
There are signs of the potential formation of a longer-term base with the market trading down into a meaningful longer-term support zone. Only a monthly close below 0.6200 would give reason for rethink. Back above 0.6900 will take the big picture pressure off the downside and strengthen case for a bottom.AUDUSD – fundamental overview
The Australian Dollar has been better bid on Wednesday, getting a boost from the news of China considering a proposal to have local governments buy millions of unsold homes in an attempt to save the property market. On the data front, the Aussie wage price index came in on the softer side of expectation, marking a back to back below forecast reading for the first time in 14 quarters. Meanwhile, the Treasury confirmed the second straight surplus for 2023 and 2024, but also announced above expectations deficits for 2024-2025, and 2025-2026. Key standouts on Wednesday’s calendar include Eurozone employment, Eurozone industrial production, Canada housing starts, US CPI, US retail sales, New York empire manufacturing, US business inventories, NAHB housing, and Fed speak.USDCAD – technical overview
Above 1.3000 signals an end to a period of longer-term bearish consolidation and suggests the market is in the process of carving out a more significant longer-term base. Next key resistance now comes in up into the 1.4000 area. Setbacks should be very well supported down into the 1.3000 area.USDCAD – fundamental overview
Canada wholesale sales came in on the softer side and the price of oil came back under pressure, which kept the Canadian Dollar from wanting to rally too much despite broad based currency demand against the Buck. Key standouts on Wednesday’s calendar include Eurozone employment, Eurozone industrial production, Canada housing starts, US CPI, US retail sales, New York empire manufacturing, US business inventories, NAHB housing, and Fed speak.NZDUSD – technical overview
Overall pressure remains on the downside with the market continuing to stall out on runs up into the 0.6500 area. At the same time, there are some signs of the market wanting to put in a longer-term base. Ultimately, a break back above 0.6500 would be required to take the medium-term pressure off the downside and encourage this prospect. A monthly close below 0.5800 will intensify bearish price action.NZDUSD – fundamental overview
Currencies are bid, risk assets are bid, and commodities are bid, all helping to prop the correlated New Zealand Dollar on this Thursday. Key standouts on Wednesday’s calendar include Eurozone employment, Eurozone industrial production, Canada housing starts, US CPI, US retail sales, New York empire manufacturing, US business inventories, NAHB housing, and Fed speak.US SPX 500 – technical overview
Longer-term technical studies continue to look quite extended after pushing to fresh record highs, begging for a deeper correction ahead. Look for rallies to be well capped in favor of lower tops and lower lows. Next key support comes in at 4921.US SPX 500 – fundamental overview
Though we have seen a healthy adjustment of investor expectations towards the amount of rate cuts in 2024, the market still hopes policy will end up erring more towards the investor friendly, accommodative side of things. This bet has kept stocks well bid into dips and consistently pushing record highs. The trouble right now is that inflation has been showing signs of ticking back up, all while the market contends with additional uncertainty around geopolitical risk.GOLD (SPOT) – technical overview
The 2019 breakout above the 2016 high at 1375 was a significant development, opening the door for fresh record highs. Setbacks should now be well supported above 1900 on a monthly close basis ahead of the next major upside extension towards 2500.GOLD (SPOT) – fundamental overview
The yellow metal has pushed record highs in 2024 with solid demand from medium and longer-term accounts. These players are more concerned about inflation, geopolitical risk and a less upbeat global growth outlook. All of this should keep the commodity well supported, with many market participants also fleeing to the hard asset as the grand dichotomy of record high equities and record low yields comes to an end.