


Next 24 hours: A mild wave of risk off flow
Today’s report: Back to worrying about slower US growth and sticky inflation
Initially, currencies were able to find some momentum on the back of an early Monday Euro rally brought on by relief around the first round of the French election. But all of this faded rather quickly, and the focus shifted back to the US side of the equation.
Wake-up call
- election result
- mortgage approvals
- Solid Tankan
- AUDUSD Sticky inflation keeps Aussie supported
- Stats Canada
- risk sentiment
- Fed outlook
- Macro themes
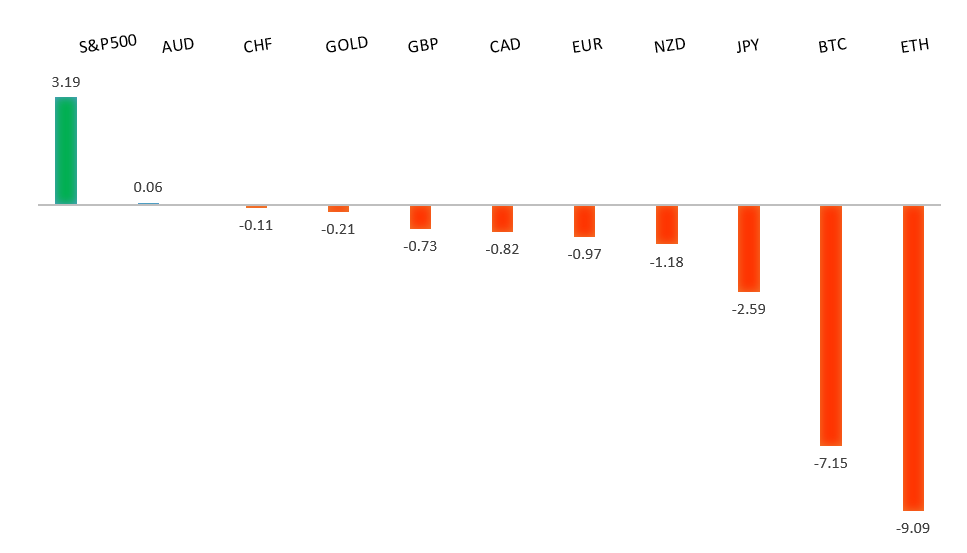
Peformance chart: 30-Day Performance vs. US dollar (%)
Suggested reading
- The Corporate Default Wave That Never Happened, Fisher Investments (June 27, 2024)
- Is Europe Finally A Buy For Investors?, B. Carlson, AWCS (June 28, 2024)
Chart talk: Technical & fundamental highlights
Choose pair:
EURUSD – technical overview
The Euro has been in a multi-month consolidation since bottoming out in 2022. Setbacks have since been exceptionally well supported on dips below 1.0500, with a higher platform sought out ahead of the next major upside extension. Look for a push through the 2023 high at 1.1276 to strengthen the constructive outlook and extend the recovery run towards 1.2000. Only back below 1.0400 negates.EURUSD – fundamental overview
The Euro has enjoyed a small relief rally after Marine Le Pen fell short of an outright majority in the first round of the French election. Key standouts on Tuesday’s calendar come from Eurozone inflation and unemployment, Canada manufacturing PMIs, a Fed Chair Powell speech, and US JOLTs job openings.EURUSD - Technical charts in detail
GBPUSD – technical overview
Signs have emerged of the market wanting to put in a longer-term base after collapsing to a record low in September 2022. The door is now open for the next major upside extension towards the 2023 high at 1.3143. Any setbacks should be well supported ahead of 1.2000.GBPUSD – fundamental overview
The Pound is coming out of a Monday session where it underperformed slightly after UK mortgage approvals slowed for a second month, and UK manufacturing PMIs were revised lower. Odds for a BOE August rate cut sit just shy of 66%. Key standouts on Tuesday’s calendar come from Eurozone inflation and unemployment, Canada manufacturing PMIs, a Fed Chair Powell speech, and US JOLTs job openings.USDJPY – technical overview
The market remains confined to a strong uptrend, most recently extending to a multi-year high through 160.00. Key support comes in at 151.95, with only a weekly close below to delay the constructive outlook. Next major resistance comes in at 165.00.USDJPY – fundamental overview
The Yen continued to extend declines to fresh multi-year lows and wasn't able to get any help from a better than expected Japanese Tankan survey. Despite the weakness, the local market is only pricing a 60% chance for a rate hike at the end of the month. Traders continue to doubt intervention threats. Key standouts on Tuesday’s calendar come from Eurozone inflation and unemployment, Canada manufacturing PMIs, a Fed Chair Powell speech, and US JOLTs job openings.AUDUSD – technical overview
There are signs of the potential formation of a longer-term base with the market trading down into a meaningful longer-term support zone. Only a monthly close below 0.6200 would give reason for rethink. Back above 0.6900 will take the big picture pressure off the downside and strengthen case for a bottom.AUDUSD – fundamental overview
The Australian Dollar has held up relatively well into dips, getting help from sticky local inflation expectations. The June Melbourne Institute Inflation index turned up for the first time this year. Key standouts on Tuesday’s calendar come from Eurozone inflation and unemployment, Canada manufacturing PMIs, a Fed Chair Powell speech, and US JOLTs job openings.USDCAD – technical overview
Above 1.3000 signals an end to a period of longer-term bearish consolidation and suggests the market is in the process of carving out a more significant longer-term base. Next key resistance now comes in up into the 1.4000 area. Setbacks should be very well supported down into the 1.3000 area.USDCAD – fundamental overview
The Canadian Dollar wasn't impressed at all with a surge in the price of oil, instead getting hit hard on Monday after Stats Canada said growth faded in May. The market has been pushing more towards a Bank of Canada rate cut and this has been weighing on the Canadian Dollar. Key standouts on Tuesday’s calendar come from Eurozone inflation and unemployment, Canada manufacturing PMIs, a Fed Chair Powell speech, and US JOLTs job openings.NZDUSD – technical overview
Overall pressure remains on the downside with the market continuing to stall out on runs up into the 0.6500 area. At the same time, there are some signs of the market wanting to put in a longer-term base. Ultimately, a break back above 0.6500 would be required to take the medium-term pressure off the downside and encourage this prospect. A monthly close below 0.5800 will intensify bearish price action.NZDUSD – fundamental overview
The New Zealand Dollar has been thinking more about the possible impact of a Trump Presidency after last week's debate. US-China trade is back in the crosshairs and could be something that weighs on the risk correlated currency. Key standouts on Tuesday’s calendar come from Eurozone inflation and unemployment, Canada manufacturing PMIs, a Fed Chair Powell speech, and US JOLTs job openings.US SPX 500 – technical overview
Longer-term technical studies continue to look quite extended, begging for a deeper correction ahead. At the same time, the latest bullish breakout to a fresh record high beyond the 2024 high opens the door for the next measured move upside extension targeting the 5650 area. Key support comes in at 5194.US SPX 500 – fundamental overview
Though we have seen a healthy adjustment of investor expectations towards the amount of rate cuts in 2024, the market still hopes policy will end up erring more towards the investor friendly, accommodative side of things. This bet has kept stocks well bid into dips and consistently pushing record highs. Still, if there is a sense the Fed will need to be more sensitive towards erring on the side of higher rates, it could invite major disruption to the stock market.GOLD (SPOT) – technical overview
The 2019 breakout above the 2016 high at 1375 was a significant development, opening the door for fresh record highs and this next major upside extension into the 2500-3000 area. Setbacks should now be well supported above 2000 on a monthly close basis.GOLD (SPOT) – fundamental overview
The yellow metal has pushed record highs in 2024 with solid demand from medium and longer-term accounts. These players are more concerned about inflation, geopolitical risk and a less upbeat global growth outlook. All of this should keep the commodity well supported, with many market participants also fleeing to the hard asset as the grand dichotomy of record high equities and record low yields comes to an end.