


Today’s report: All eyes on US employment report
The Barnier resignation and conciliatory remarks from Marine Le Pen suggest the worst could be over in France, though the market will be wanting to see what President Macron does over the weekend with respect to his new appointment.
Wake-up call
- weekend news
- BOE Greene
- household spending
- RBA
- employment report
- policy outlook
- political outlook
- Macro themes
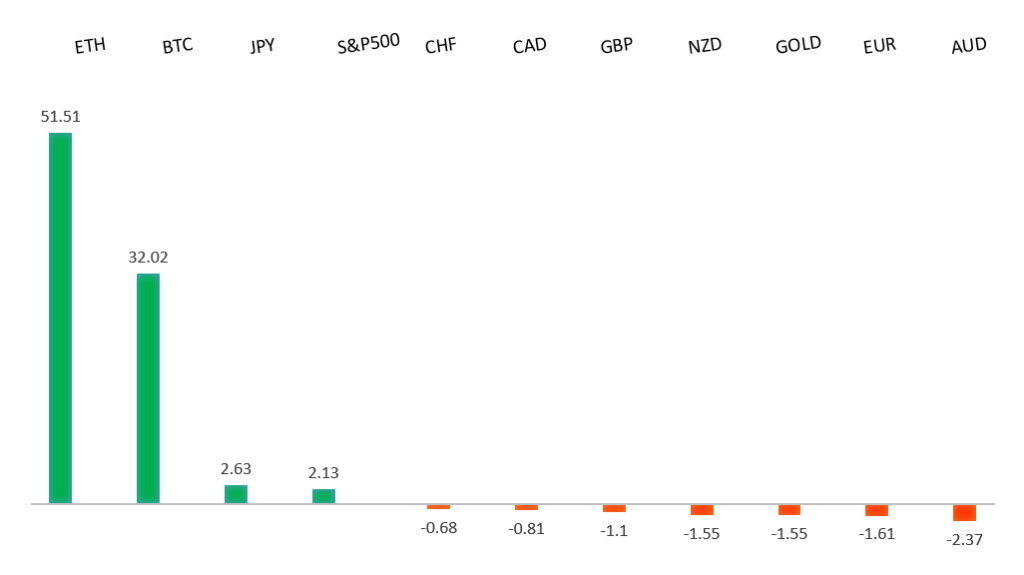
Peformance chart: 30-Day Performance vs. US dollar (%)
Suggested reading
- Sadiq Khan on hunger in London classrooms, M. Green, Financial Times (December 4, 2024)
- All aboard La Dolce Vita Orient Express with chef Heinz Beck, Financial Times (December 6, 2024)
Chart talk: Technical & fundamental highlights
Choose pair:
EURUSD – technical overview
The Euro has been in a multi-month consolidation since bottoming out in 2022. Setbacks have since been exceptionally well supported on dips below 1.0500, with a higher platform sought out ahead of the next major upside extension. Look for a major bounce in the days ahead and the start to a push back towards the 2023 high at 1.1276. Only a monthly close below 1.0400 negates.EURUSD – fundamental overview
At the moment, the Euro is sitting nervously still, waiting for the weekend news to find out if President Macron's choice of the new premier will be enough to resolve the political impasse with the opposition. Key standouts on Friday’s calendar come from Eurozone GDP, Canada employment, the monthly employment report out of the US, Canada Ivey PMIs, US Michigan sentiment, and Fed speak.EURUSD - Technical charts in detail
GBPUSD – technical overview
Signs have emerged of the market wanting to put in a longer-term base after collapsing to a record low in September 2022. The door is now open for the next major upside extension towards the 2018 high at 1.4377. Setbacks should be well supported above 1.2500 on a monthly close basis.GBPUSD – fundamental overview
The latest BOE Greene comments have been a major prop for the Pound after the central banker talked about 'fundamentally more persistent' inflation, stubborn wage growth and services inflation. Meanwhile, on the data front, UK construction PMIs came in higher. Key standouts on Friday’s calendar come from Eurozone GDP, Canada employment, the monthly employment report out of the US, Canada Ivey PMIs, US Michigan sentiment, and Fed speak.USDJPY – technical overview
The market is looking to resume the longer-term uptrend after an intense correction in 2024. A higher low is ideally sought out above 140.00 in favor of a bullish continuation. The recent weekly close back above 150.00 strengthens the case for longer-term uptrend resumption.USDJPY – fundamental overview
Economic data out of Japan has helped to support the Yen on Friday, with the currency getting a boost from solid household spending data. The market is also continuing to lean slightly in favor of another BOJ rate hike this month. Key standouts on Friday’s calendar come from Eurozone GDP, Canada employment, the monthly employment report out of the US, Canada Ivey PMIs, US Michigan sentiment, and Fed speak.AUDUSD – technical overview
There are signs of the potential formation of a longer-term base with the market trading down into a meaningful longer-term support zone. Only a monthly close below 0.6200 would give reason for rethink. A monthly close back above 0.7000 will take the big picture pressure off the downside and strengthen case for a bottom.AUDUSD – fundamental overview
The Australian Dollar has been having a tougher time of late, particularly after taking in a softer round of Aussie GDP earlier in the week which is forcing a reconsideration of the RBA's tone when it meets next week. Key standouts on Friday’s calendar come from Eurozone GDP, Canada employment, the monthly employment report out of the US, Canada Ivey PMIs, US Michigan sentiment, and Fed speak.USDCAD – technical overview
A sustained hold above 1.3000 over the past several months signals an end to a period of longer-term bearish consolidation and suggests the market is in the process of carving out a more significant longer-term base. Next key resistance now comes in up into the 1.4500-1.5000 area, exposing a retest of the 2020 high just ahead of 1.4700. Setbacks should be very well supported down into the 1.3000 area.USDCAD – fundamental overview
The Canadian Dollar tried to find some momentum on Thursday, getting help from the on the whole better than expected Canada trade data which showed a decline in the trade deficit from September. Key standouts on Friday’s calendar come from Eurozone GDP, Canada employment, the monthly employment report out of the US, Canada Ivey PMIs, US Michigan sentiment, and Fed speak.NZDUSD – technical overview
Overall pressure remains on the downside with the market continuing to stall out on runs up into the 0.6500 area. At the same time, there are some signs of the market wanting to put in a longer-term base. Ultimately, a break back above 0.6500 would be required to take the medium-term pressure off the downside and encourage this prospect. A monthly close below 0.5800 will intensify bearish price action.NZDUSD – fundamental overview
The New Zealand Dollar continues to struggle with dovish RBNZ policy and the prospect for another 50-basis point rate cut in February, which Governor Orr hinted at. Key standouts on Friday’s calendar come from Eurozone GDP, Canada employment, the monthly employment report out of the US, Canada Ivey PMIs, US Michigan sentiment, and Fed speak.US SPX 500 – technical overview
The longer term uptrend remains intact and dips continue to be exceptionally well supported. Critical support comes in at 5679, with only a break back below this level to compromise the structure and open the door for a more significant corrective decline. Until then, the focus remains on a continued push to fresh record highs.US SPX 500 – fundamental overview
The US equities market remains exceptionally well supported in 2024 on the back of an ongoing expectation for more rate cuts than less going forward. Investors are feeling better about a soft landing in the US economy and this has also been accompanied by an accommodative adjustment of Fed policy. Moreover, there has been a fresh wave of market optimism in the aftermath of the Trump election victory. It will however be important to keep an eye on inflation, bigger picture economic data, and geopolitical risk in the weeks and months ahead.GOLD (SPOT) – technical overview
The 2019 breakout above the 2016 high at 1375 was a significant development, opening the door for fresh record highs and this next major upside extension into the 3000 area. Setbacks should now be well supported above 2500 on a monthly close basis.GOLD (SPOT) – fundamental overview
The yellow metal has pushed record highs in 2024 with solid demand from medium and longer-term accounts. These players are more concerned about inflation, geopolitical risk and a less upbeat global growth outlook. All of this should keep the commodity well supported over the coming months.