


Next 24 hours: Dollar index to lowest level since October
Today’s report: A sea of red for US equities
It's been ugly out there. US equities just went through another day of red and are already down quite a bit this month. The NASDAQ has been the biggest loser of the three major US indices, down some 8% in March.
Wake-up call
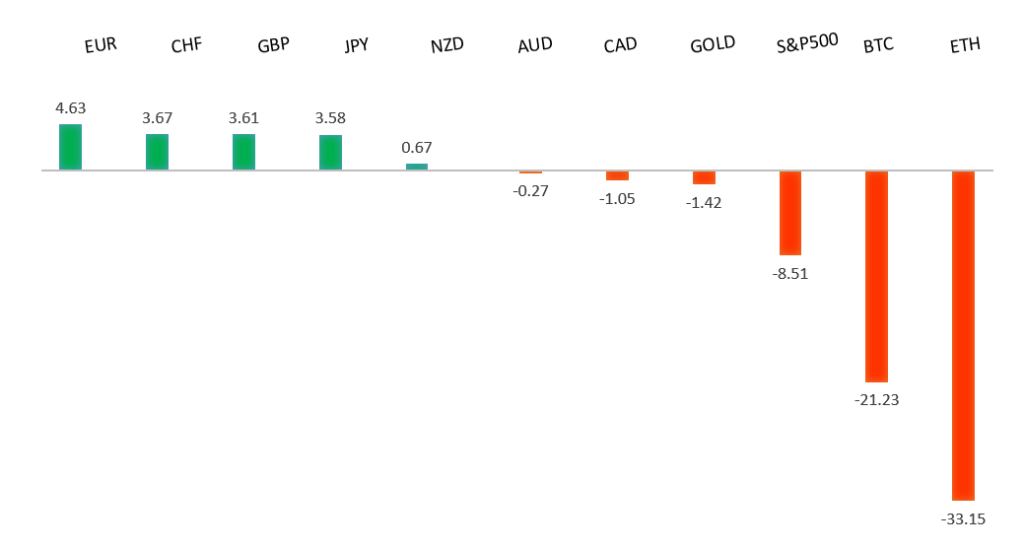
Peformance chart: 30-Day Performance vs. US dollar (%)
Suggested reading
- So Go the Top Earners, So Goes the Economy?, Fisher Investments (March 6, 2025)
- Universal Bullishness on Wall Street Is a Bearish Signal, S. McBride, RiskHedge (March 7, 2025)
Chart talk: Technical & fundamental highlights
Choose pair:
EURUSD – technical overview
The Euro has been in a multi-month consolidation since bottoming out in 2022. Setbacks have since been exceptionally well supported on dips towards parity, with a higher platform sought out ahead of the next major upside extension. Look for a push back towards the 2023 high at 1.1276 in the days ahead. Only a monthly close below 1.0000 negates.EURUSD – fundamental overview
The Euro continues to hold up near recent highs but has run into some resistance after Germany's Green Party failed to support the historical government spending plan. Key standouts on Tuesday’s calendar come from US NFIB business optimism and US JOLTs job openings.EURUSD - Technical charts in detail
GBPUSD – technical overview
Signs have emerged of the market wanting to put in a longer-term base after collapsing to a record low in September 2022. The door is now open for the next major upside extension towards the 2018 high at 1.4377. Setbacks should be well supported above 1.2000 on a monthly close basis.GBPUSD – fundamental overview
The Pound gave back gains after the BOE survey showed wages for new hires rising at their slowest rate in four years. Key standouts on Tuesday’s calendar come from US NFIB business optimism and US JOLTs job openings.USDJPY – technical overview
There are signs of a meaningful top in place after the market put in a multi-year high in 2024. At this point, the door is now open for a deeper setback towards the 140 area.USDJPY – fundamental overview
The Yen continues to benefit from hawkish BOJ rhetoric, Japan economic data, shifting Fed expectations and broad based US Dollar selling. Japanese workers have seen their base pay rise at the fastest pace in 32 years. Key standouts on Tuesday’s calendar come from US NFIB business optimism and US JOLTs job openings.AUDUSD – technical overview
There are signs of the potential formation of a longer-term base with the market trading down into a meaningful longer-term support zone. Only a monthly close below 0.6000 would give reason for rethink. A monthly close back above 0.7000 will take the big picture pressure off the downside and strengthen case for a bottom.AUDUSD – fundamental overview
All of this recent worry around the outlook for the US economy amidst escalating trade tension and an unpredictable set of US administration policies has opened some broad based US Dollar outflows. However, this latest run of intense risk off flow in global markets has been having a negative impact on the risk correlated Australian Dollar. Key standouts on Tuesday’s calendar come from US NFIB business optimism and US JOLTs job openings.USDCAD – technical overview
A sustained hold above 1.3000 over the past several months signals an end to a period of longer-term bearish consolidation and suggests the market is in the process of carving out a more significant longer-term base. Next key resistance now comes in at the 1.5000 psychological barrier. Setbacks should be very well supported ahead of 1.4000.USDCAD – fundamental overview
The Canadian Dollar can't get away from tariff woes in 2025 and has just come under renewed pressure after China imposed its own round of tariffs on various Canadian goods. The move follows Canada tariffs imposed on Chinese goods last year. Meanwhile, risk off flow and downside pressure on the price of oil are only fueling more Canadian Dollar selling. Key standouts on Tuesday’s calendar come from US NFIB business optimism and US JOLTs job openings.NZDUSD – technical overview
Overall pressure remains on the downside with the market continuing to stall out on runs up into the 0.6500 area. At the same time, there are some signs of the market wanting to put in a longer-term base. Ultimately, a break back above 0.6500 would be required to take the medium-term pressure off the downside and encourage this prospect. A monthly close below 0.5469 will intensify bearish price action.NZDUSD – fundamental overview
All of this recent worry around the outlook for the US economy amidst escalating trade tension and an unpredictable set of US administration policies has opened some broad based US Dollar outflows. However, this latest run of intense risk off flow in global markets has been having a negative impact on the risk correlated New Zealand Dollar.Key standouts on Tuesday’s calendar come from US NFIB business optimism and US JOLTs job openings.US SPX 500 – technical overview
The longer term uptrend remains intact and dips continue to be exceptionally well supported. Critical support comes in at 5386, with only a weekly close back below this level to compromise the structure. Until then, the focus remains on the formation of the next major higher low.US SPX 500 – fundamental overview
Going forward, it will be important to keep an eye on Trump trade policies, inflation, bigger picture economic data and the Fed policy outlook. Any of these variables are capable of easily ruffling some feathers and we've already seen a little of this as 2025 gets going.GOLD (SPOT) – technical overview
The 2019 breakout above the 2016 high at 1375 was a significant development, opening the door for fresh record highs and this next major upside extension into the 3000 area. Setbacks should now be well supported above 2500 on a monthly close basis.GOLD (SPOT) – fundamental overview
The yellow metal has pushed record highs in recent months with solid demand from medium and longer-term accounts. These players are more concerned about inflation, geopolitical risk and a less upbeat global growth outlook. All of this should keep the commodity well supported over the coming months.