


Today’s report: The weight of central bank warnings
The fact that all four central banks that met this week came out with the same warnings around global trade uncertainties has been enough to keep investors from wanting to get too excited. Key standouts on Friday’s calendar for the remainder of the day come from UK public sector net borrowing, the Eurozone current account, UK CBI trends, Canada housing data, and Canada retail sales.
Wake-up call
- Trump/Putin call
- hawkish hold
- trade threats
- feeling pain
- BoC Macklem
- trade tension
- Trump policies
- Macro themes
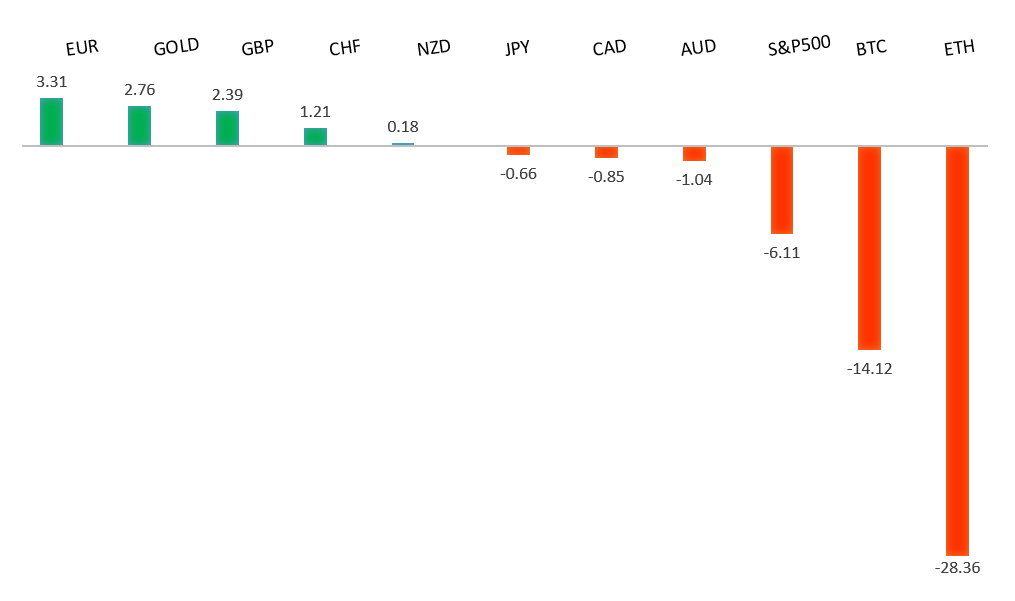
Peformance chart: 30-Day Performance vs. US dollar (%)
Suggested reading
- Is the Stock Market Cheap Yet?, S. Hansen, Morningstar (March 20, 2025)
- 5 Stocks For An American Manufacturing Renaissance, A. Root, Barrons (March 20, 2025)
Chart talk: Technical & fundamental highlights
Choose pair:
EURUSD – technical overview
The Euro has been in a multi-month consolidation since bottoming out in 2022. Setbacks have since been exceptionally well supported on dips towards parity, with a higher platform sought out ahead of the next major upside extension. Look for a push back towards the 2023 high at 1.1276 in the days ahead. Only a monthly close below 1.0000 negates.EURUSD – fundamental overview
The Euro has been feeling a little vulnerable after an impressive run and has perhaps been weighed down a bit on a souring reaction to the Trump/Putin call. Key standouts on Friday’s calendar come from UK public sector net borrowing, the Eurozone current account, UK CBI trends, Canada housing data, and Canada retail sales.EURUSD - Technical charts in detail
GBPUSD – technical overview
Signs have emerged of the market wanting to put in a longer-term base after collapsing to a record low in September 2022. The door is now open for the next major upside extension towards the 2018 high at 1.4377. Setbacks should be well supported above 1.2000 on a monthly close basis.GBPUSD – fundamental overview
The Pound has been in correction mode on a sell the fact reaction to yesterday's BOE decision. In the end, the central bank kept rates on hold and offered up a balanced outlook as widely expected. However, there was a little bit of a hawkish shift, with the voting split moving to 8-1. Key standouts on Friday’s calendar come from UK public sector net borrowing, the Eurozone current account, UK CBI trends, Canada housing data, and Canada retail sales.USDJPY – technical overview
There are signs of a meaningful top in place after the market put in a multi-year high in 2024. At this point, the door is now open for a deeper setback towards the 140 area.USDJPY – fundamental overview
We've seen some Yen selling into the end of the week, this despite Japan inflation data that continues to point higher. It seems the market continues to be focused on potential fallout to the Yen from US trade policies. Key standouts on Friday’s calendar come from UK public sector net borrowing, the Eurozone current account, UK CBI trends, Canada housing data, and Canada retail sales.AUDUSD – technical overview
There are signs of the potential formation of a longer-term base with the market trading down into a meaningful longer-term support zone. Only a monthly close below 0.6000 would give reason for rethink. A monthly close back above 0.7000 will take the big picture pressure off the downside and strengthen case for a bottom.AUDUSD – fundamental overview
The Australian Dollar is still feeling stress from this week's softer Aussie employment data while also coming under pressure on a deterioration in global sentiment amidst worry around US trade policy and potential slowdown in China. Key standouts on Friday’s calendar come from UK public sector net borrowing, the Eurozone current account, UK CBI trends, Canada housing data, and Canada retail sales.USDCAD – technical overview
A sustained hold above 1.3000 over the past several months signals an end to a period of longer-term bearish consolidation and suggests the market is in the process of carving out a more significant longer-term base. Next key resistance now comes in at the 1.5000 psychological barrier. Setbacks should be very well supported ahead of 1.4000.USDCAD – fundamental overview
Bank of Canada Macklem was out on the wires saying the central bank will be less forward-looking than normal until the situation around US tariffs was clearer. The comment leans to the hawkish side re the BoC holding off from making any hasty decisions, and this has helped the Canadian Dollar. Key standouts on Friday’s calendar come from UK public sector net borrowing, the Eurozone current account, UK CBI trends, Canada housing data, and Canada retail sales.NZDUSD – technical overview
Overall pressure remains on the downside with the market continuing to stall out on runs up into the 0.6500 area. At the same time, there are some signs of the market wanting to put in a longer-term base. Ultimately, a break back above 0.6500 would be required to take the medium-term pressure off the downside and encourage this prospect. A monthly close below 0.5469 will intensify bearish price action.NZDUSD – fundamental overview
Global trade tension and US tariff threats are keeping the New Zealand Dollar on the back foot into the end of the week. Key standouts on Friday’s calendar come from UK public sector net borrowing, the Eurozone current account, UK CBI trends, Canada housing data, and Canada retail sales.US SPX 500 – technical overview
The longer term uptrend remains intact and dips continue to be exceptionally well supported. Critical support comes in at 5386, with only a weekly close back below this level to compromise the structure. Until then, the focus remains on the formation of the next major higher low.US SPX 500 – fundamental overview
Going forward, it will be important to keep an eye on Trump trade policies, inflation, bigger picture economic data and the Fed policy outlook. Any of these variables are capable of easily ruffling some feathers and we've already seen a little of this as 2025 gets going.GOLD (SPOT) – technical overview
The 2019 breakout above the 2016 high at 1375 was a significant development, opening the door for fresh record highs and this next major upside extension towards 3100. Setbacks should now be well supported above 2500 on a monthly close basis.GOLD (SPOT) – fundamental overview
The yellow metal has pushed record highs in recent months with solid demand from medium and longer-term accounts. These players are more concerned about inflation, geopolitical risk and a less upbeat global growth outlook. All of this should keep the commodity well supported over the coming months.