


Next 24 hours: Dollar ignores US equity futures
Today’s report: Stagflation risk haunts financial markets
The market can’t seem to get away from worry around stagflation risk in 2022, and for good reason, with inflation continuing to shoot up, all while we’re seeing signs of slowdown in growth.
Wake-up call
- Euro stalls
- Pound underperforms
- traditional correlation
- Mixed employment
- Inflation jumps
- PPI
- Stocks vulnerable
- Dealers report
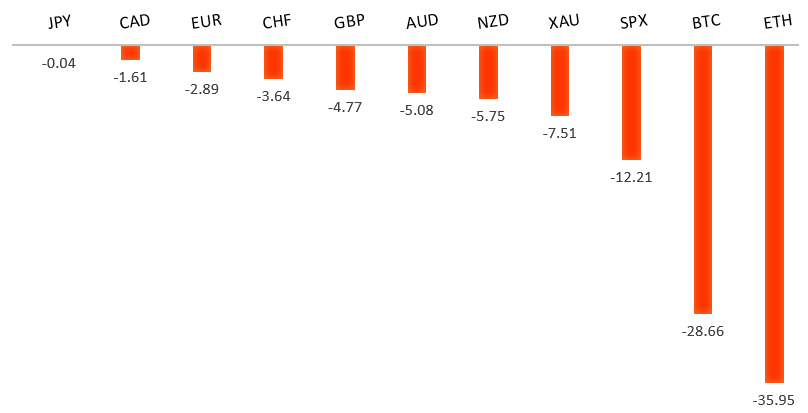
Peformance chart: 30 Day Performance vs. US dollar (%)
Suggested reading
- There's a Whiff of Fearful Symmetry in the Air, J. Authers, Bloomberg (May 19, 2022)
- Are Electric Air Taxis and Commuter Planes Getting Closer?, C. Middlehurst, Financial Times (May 13, 2022)
Chart talk: Technical & fundamental highlights
Choose pair:
EURUSD – technical overview
The market has come under intense pressure in recent weeks, with setbacks accelerating to retest the multi-year low from 2017. A clear break below 1.0300 now sets up the next downside extension towards parity. At the same time, technical studies are looking rather oversold and warn of a bounce over the coming sessions. Back above 1.0650 would be required at a minimum to take the immediate pressure off the downside.EURUSD – fundamental overview
The Euro recovery has stalled out, with the single currency running into resistance as risk assets come back under pressure. It seems it will be hard for the Euro to sustain upside momentum until the market actually sees ECB rate hikes, with hawkish talk only going so far. Key standouts on today’s calendar come from Eurozone construction output, the ECB Minutes, Canada producer prices, the US Philly Fed, US initial jobless claims, and US existing home sales.EURUSD - Technical charts in detail
GBPUSD – technical overview
The recent drop below 1.2500 has accelerated declines, with the market firmly focused on next key support in the form of the 2019 low around 1.1960. However, if indeed we do see a test of this level over the coming days, additional setbacks should be very well supported with technical studies highly extended and a bullish reversal anticipated. Back above 1.2640 will be required to take the immediate pressure off the downside.GBPUSD – fundamental overview
The Pound was back to underperforming on Wednesday, this after the runaway inflation number worries the market about the BOE being boxed in. Pressure on the BOE to hike has increased, but the central bank is still needing to worry about signs of a sharp slowdown in the economy. Key standouts on today’s calendar come from Eurozone construction output, the ECB Minutes, Canada producer prices, the US Philly Fed, US initial jobless claims, and US existing home sales.USDJPY – technical overview
The market has rocketed higher to its highest levels since 2002 after breaking through the 2015 high. Technical studies are however in the process of unwinding from overbought readings, with scope for a sizable correction in the weeks ahead. Look for additional upside from here to be limited to the 130.00 area for now. A break back below 127.00 would confirm the likelihood of a deeper pullback.USDJPY – fundamental overview
We are finally seeing evidence of a Yen that has perhaps fallen a little too hard and fast on monetary policy divergence between the BOJ and Fed. Instead, recent price action suggests the Yen is still in demand on the back of traditional correlations with risk off flow. Key standouts on today’s calendar come from Eurozone construction output, the ECB Minutes, Canada producer prices, the US Philly Fed, US initial jobless claims, and US existing home sales.AUDUSD – technical overview
The market has dropped back to a critical internal support level in the form of the 2016 low. A breakdown below this level would open the door for a bearish continuation towards 0.6000. Back above 0.7265 would be required to take the immediate pressure off the downside.AUDUSD – fundamental overview
A mixed Aussie jobs report hasn't really factored into price action. Instead, the currency is trading off bigger picture themes. Wednesday's dump in risk sentiment had weighed on the currency, before things have stabilized a bit into Thursday. Key standouts on today’s calendar come from Eurozone construction output, the ECB Minutes, Canada producer prices, the US Philly Fed, US initial jobless claims, and US existing home sales.USDCAD – technical overview
The latest surge back above 1.3000 ends a period of bearish consolidation and suggests the market is in the process of carving out a more significant longer-term base. Next key resistance now comes in up into the 1.3500 area. Any setbacks should be very well supported down into the 1.2500 area.USDCAD – fundamental overview
Wednesday's bout of risk off flow weighed on the Canadian Dollar, though the currency tried hard to outperform relative to its peers on the back of the hotter than expected inflation print out of Canada. We're seeing the fastest jump in inflation since 1991. Key standouts on today’s calendar come from Eurozone construction output, the ECB Minutes, Canada producer prices, the US Philly Fed, US initial jobless claims, and US existing home sales.NZDUSD – technical overview
The market has been trending lower since topping out in 2021, making a series of lower highs and lower lows. The focus is now squarely on a retest of the 2015 low which comes in just ahead of 0.6100. Back above 0.6570 would be required to take the immediate pressure off the downside.NZDUSD – fundamental overview
The New Zealand Dollar had suffered at the hands of risk liquidation flow on Wednesday, but has found some demand into Thursday as risk assets recover. We've also seen Kiwi demand after the New Zealand government announced a cost-of-living package in the annual budget to help low and middle-income families. And higher producer prices are also factoring into some Kiwi demand as rate hike expectations ramp up. Key standouts on today’s calendar come from Eurozone construction output, the ECB Minutes, Canada producer prices, the US Philly Fed, US initial jobless claims, and US existing home sales.US SPX 500 – technical overview
Longer-term technical studies are in the process of unwinding from extended readings off record highs. Look for rallies to be well capped in favor of lower tops and lower lows. Back above 4,312 will be required at a minimum to take the immediate pressure off the downside. Next major support comes in around 3,400.US SPX 500 – fundamental overview
With so little room for additional central bank accommodation, given an already depressed interest rate environment, the prospect for sustainable runs to the topside on easy money policy incentives and government stimulus, should no longer be as enticing to investors. Meanwhile, ongoing worry associated with coronavirus fallout, rising inflation, and geopolitical tension should continue to weigh more heavily on investor sentiment in 2022.GOLD (SPOT) – technical overview
The 2019 breakout above the 2016 high at 1375 was a significant development, opening the door for fresh record highs. Setbacks should now be well supported above 1700.GOLD (SPOT) – fundamental overview
The yellow metal continues to be well supported on dips with solid demand from medium and longer-term accounts. These players are more concerned about exhausted monetary policy, extended global equities, coronavirus fallout, inflation risk, and geopolitical tension. All of this should keep the commodity well supported, with many market participants also fleeing to the hard asset as the grand dichotomy of record high equities and record low yields comes to an unnerving climax.