


Special report: US CPI Preview
Today’s report: Plenty of confidence ahead of key calendar event
The upbeat tone has continued into the latter half of the week, with stocks rallying and the US Dollar on the defensive. The market is really pushing for a less aggressive Fed going forward and is positioning for another miss on that highly anticipated US CPI print due later today.
Wake-up call
- ECB Rehn
- healthcare strike
- bond buying
- economic data
- hawkish BoC
- housing data
- Inflation headache
- Dealers report
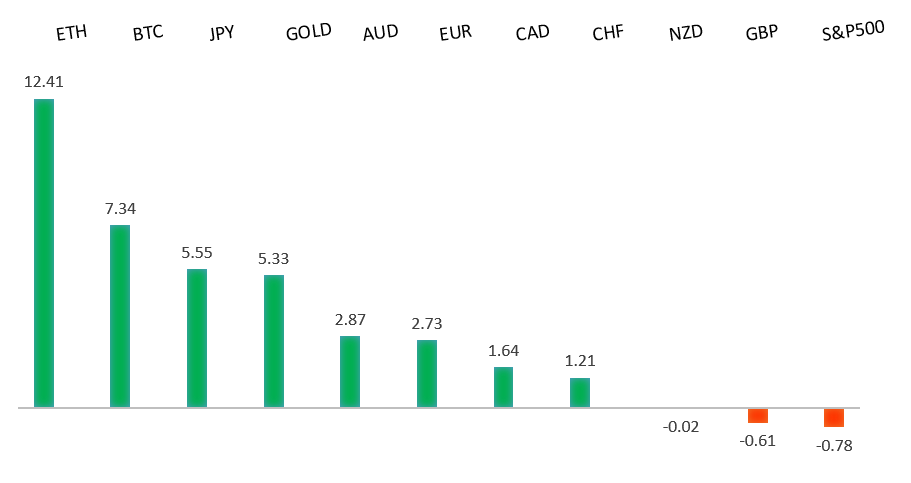
Peformance chart: 30 Day Performance vs. US dollar (%)
Suggested reading
- Is 2% Inflation in View? Careful What You Wish For, J. Authers, Bloomberg (January 12, 2023)
- In the Midst of Crypto Winter, Regulators Must Turn Up the Heat, J. Jiang, The Hill (January 9, 2023)
Chart talk: Technical & fundamental highlights
Choose pair:
EURUSD – technical overview
The Euro recovery has finally run back above meaningful previous support turned resistance at 1.0635. The December close above this level further encourages the recovery outlook and makes a stronger case for the formation of a longer-term bottom. Any setbacks should now be well supported ahead of 1.0200.EURUSD – fundamental overview
Goldman Sachs has been impressed by the resilience of the Eurozone economy and has come out calling for no recession. This of course has opened more demand for the single currency. We've also seen demand after ECB's Rehn said rates must rise significantly, and must reach restrictive levels. Key standouts on Thursday’s calendar come from US CPI and initial jobless claims.EURUSD - Technical charts in detail
GBPUSD – technical overview
Signs have emerged of the market wanting to put in a longer-term base after collapsing to a record low in September. The latest weekly close back above the September high at 1.1739 strengthens this prospect. Any setbacks should now be well supported ahead of 1.1100. Next key resistance comes in at 1.2668.GBPUSD – fundamental overview
The Pound has been a real underperformer of late, taking hits on the rail and healthcare strikes which are straining the outlook for the UK economy. Key standouts on Thursday’s calendar come from US CPI and initial jobless claims.USDJPY – technical overview
Longer-term technical studies are in the process of unwinding from severe overbought readings. Look for additional corrective price action back down towards the 126.00 area before the market considers the possibility of uptrend resumption. Rallies should now be well capped ahead of 140.00.USDJPY – fundamental overview
The Yen went through a round of weakness on Wednesday after the BOJ stepped up its unscheduled bond buying. The defense of YCC has already been pressuring the Yen as well. A BNP analyst is now calling for the BOJ to widen the JGB band next week. Key standouts on Thursday’s calendar come from US CPI and initial jobless claims.AUDUSD – technical overview
There are signs of the potential formation of a longer-term base following the recent surge back above 0.6500. The recent weekly close back above previous support now turned resistance at 0.6682 strengthens the outlook for a bullish structural shift.AUDUSD – fundamental overview
The Australian Dollar was bid back up on Wednesday, getting help from hotter Aussie inflation reads and a better than expected Aussie retail sales print. Key standouts on Thursday’s calendar come from US CPI and initial jobless claims.USDCAD – technical overview
A recent surge back above 1.3000 signals an end to a period of bearish consolidation and suggests the market is in the process of carving out a more significant longer-term base. Next key resistance now comes in up into the 1.4000 area. Setbacks should be very well supported down into the 1.3000 area.USDCAD – fundamental overview
The street is now calling for a more aggressive Bank of Canada in the aftermath of last week's strong Canada jobs report. And yet, the Canadian Dollar hasn't been able to muster additional momentum on this news. Key standouts on Thursday’s calendar come from US CPI and initial jobless claims.NZDUSD – technical overview
Overall pressure remains on the downside with risk for the current recovery rally to stall out and form a lower top for the next major downside extension. A break back above 0.6577 would be required to take the immediate pressure off the downside.NZDUSD – fundamental overview
Despite gains against the US Dollar in recent sessions, the Kiwi rate has underperformed against its peers on the back of a sharp decline in housing data, a soft commodities price index, and fresh doubts about just how much the RBNZ will need to shift to a less hawkish policy stance. Key standouts on Thursday’s calendar come from US CPI and initial jobless claims.US SPX 500 – technical overview
Longer-term technical studies are in the process of unwinding from extended readings off record highs. Look for rallies to be well capped in favor of lower tops and lower lows. A monthly close back above 4300 will be required at a minimum to take the immediate pressure off the downside. Next major support comes in at 3492.US SPX 500 – fundamental overview
We've finally reached a point in the cycle where the Fed recognizes unanchored inflation expectations pose a greater downside risk than over-tightening. This is significant, as it means less investor friendly monetary policy that risks potential recession in the months ahead. Overall, we expect inflation to continue to be a problem in H1 2023 that results in downside pressure into rallies.GOLD (SPOT) – technical overview
The 2019 breakout above the 2016 high at 1375 was a significant development, opening the door for fresh record highs. Setbacks should now be well supported above 1600 on a monthly close basis ahead of the next major upside extension. The recent break back above 1808 strengthens the bullish outlook.GOLD (SPOT) – fundamental overview
The yellow metal continues to be well supported on dips with solid demand from medium and longer-term accounts. These players are more concerned about inflation risk and a less upbeat global growth outlook. All of this should keep the commodity well supported, with many market participants also fleeing to the hard asset as the grand dichotomy of record high equities and record low yields comes to an unnerving climax.