


Today’s report: Has the market been too dismissive of the signs?
Though we haven’t seen much movement in markets this week, it’s not to say the price action hasn’t been interesting. We say this because there has been a battle going on between what the data is showing us and what the market wants to believe.
Wake-up call
- current account
- housing data
- cooler CPI
- seasonal anomaly
- Oil bounce
- manufacturing contracts
- inflation risk
- Macro themes
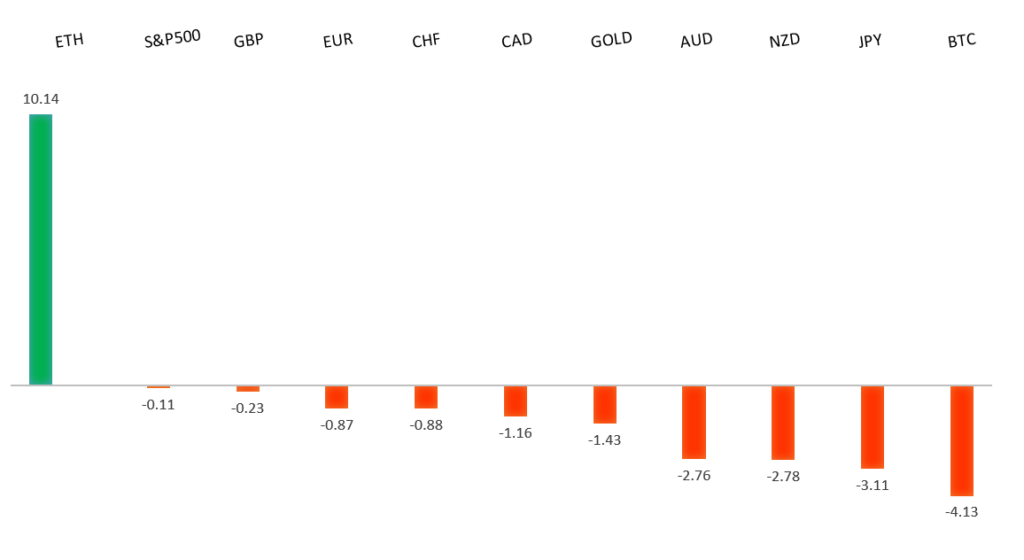
Peformance chart: 30-Day Performance vs. US dollar (%)
Suggested reading
- 10 Undervalued Dividend Stocks for 2024, D. Sekera, Morningstar (January 12, 2024)
- The Collectibles Bubbles Have Popped, G. Glover, Markets Insider (January 18, 2024)
Chart talk: Technical & fundamental highlights
Choose pair:
EURUSD – technical overview
The Euro has been in a multi-month consolidation since bottoming out in 2022. Setbacks have since been exceptionally well supported on dips below 1.0500, with a higher platform sought out ahead of the next major upside extension. Look for a push through the 2023 high at 1.1276 to strengthen the constructive outlook and extend the recovery run towards 1.2000. Only back below 1.0400 negates.EURUSD – fundamental overview
The Euro has come under some pressure as the Eurozone current account dwindles, with the surplus declining to EUR 24.6 billion from EUR 32.3 billion. New car registrations also contracted sharply. Key standouts on Friday’s calendar come from German producer prices, UK retail sales, an ECB Lagarde speech, Canada retail sales, US existing home sales, and Michigan sentiment.EURUSD - Technical charts in detail
GBPUSD – technical overview
Signs have emerged of the market wanting to put in a longer-term base after collapsing to a record low in September 2022. The November 2022 monthly close back above 1.2000 strengthens this prospect. Any setbacks should now be well supported ahead of 1.2000. Next key resistance comes in at 1.2849.GBPUSD – fundamental overview
The Pound continues to outperform relative to its peers, with the currency getting a boost this week from hot inflation data and an improved UK housing report. The RICS December house price balance improved to -30% from -41%. Key standouts on Friday’s calendar come from German producer prices, UK retail sales, an ECB Lagarde speech, Canada retail sales, US existing home sales, and Michigan sentiment.USDJPY – technical overview
The market remains confined to a strong uptrend, with sights set on a retest and break of the multi-year high from 2022 at 151.95. A push through this level will open the next major upside extension towards 155.00. Key support comes in at 140.00, with only a weekly close below to delay the constructive outlook.USDJPY – fundamental overview
More evidence of cooler inflation data in Japan, as reflected through today's CPI has given the Yen and excuse to extend declines against the Buck. Key standouts on Friday’s calendar come from German producer prices, UK retail sales, an ECB Lagarde speech, Canada retail sales, US existing home sales, and Michigan sentiment.AUDUSD – technical overview
There are signs of the potential formation of a longer-term base with the market trading down into a meaningful longer-term support zone. Only a monthly close below 0.6200 would give reason for rethink. Back above 0.6900 will take the big picture pressure off the downside and strengthen case for a bottom.AUDUSD – fundamental overview
The Australian Dollar has done a good job holding up after this week's softer Aussie jobs report. Traders have chalked the data miss up to a seasonal adjustment anomaly, all while Aussie has also been getting help from higher US equities. Key standouts on Friday’s calendar come from German producer prices, UK retail sales, an ECB Lagarde speech, Canada retail sales, US existing home sales, and Michigan sentiment.USDCAD – technical overview
Above 1.3000 signals an end to a period of longer-term bearish consolidation and suggests the market is in the process of carving out a more significant longer-term base. Next key resistance now comes in up into the 1.4000 area. Setbacks should be very well supported down into the 1.3000 area.USDCAD – fundamental overview
The Canadian Dollar got a bit of a boost on Thursday from higher commodities and equities prices. Key standouts on Friday’s calendar come from German producer prices, UK retail sales, an ECB Lagarde speech, Canada retail sales, US existing home sales, and Michigan sentiment.NZDUSD – technical overview
Overall pressure remains on the downside with the market continuing to stall out on runs up into the 0.6500 area. At the same time, there are some signs of the market wanting to put in a longer-term base. Ultimately, a break back above 0.6500 would be required to take the medium-term pressure off the downside and encourage this prospect. A monthly close below 0.5800 will intensify bearish price action.NZDUSD – fundamental overview
The New Zealand Dollar hasn't been able to ignore a contraction in manufacturing for the 10th straight month, with the currency clearly underperforming in Friday trade. Key standouts on Friday’s calendar come from German producer prices, UK retail sales, an ECB Lagarde speech, Canada retail sales, US existing home sales, and Michigan sentiment.US SPX 500 – technical overview
Longer-term technical studies continue to look quite extended, begging for a deeper correction ahead. Look for rallies to be well capped in favor of lower tops and lower lows. A monthly close back above 4800 will be required to delay the outlook. Next key support comes in at 4663.US SPX 500 – fundamental overview
The Fed has finally bent to the will of the market, with the December 2023 policy decision revealing rate projections coming down from previous and more in line with what the market has been looking for. This has translated to more investor friendly policy going forward, which could now open the door for a run to fresh record highs in 2024. At the same time, we worry inflation remains a risk both the market and Fed are not taking as seriously as needed, which could once again force the Fed back into a more restrictive path and weigh heavily on stocks.GOLD (SPOT) – technical overview
The 2019 breakout above the 2016 high at 1375 was a significant development, opening the door for fresh record highs. Setbacks should now be well supported above 1900 on a monthly close basis ahead of the next major upside extension towards 2500.GOLD (SPOT) – fundamental overview
The yellow metal continues to be well supported on dips with solid demand from medium and longer-term accounts. These players are more concerned about inflation risk and a less stable and upbeat global growth outlook. All of this should keep the commodity well supported, with many market participants also fleeing to the hard asset as the grand dichotomy of record high equities and record low yields comes to an unnerving climax.