


Next 24 hours: Recovery underway
Today’s report: Investors unhappy with latest repricing of Fed bets
It’s been abundantly clear to the market that if the Fed is forced to consider a rate cut path that is less aggressive than what investors would like to see, it won’t be good for risk appetite.
Wake-up call
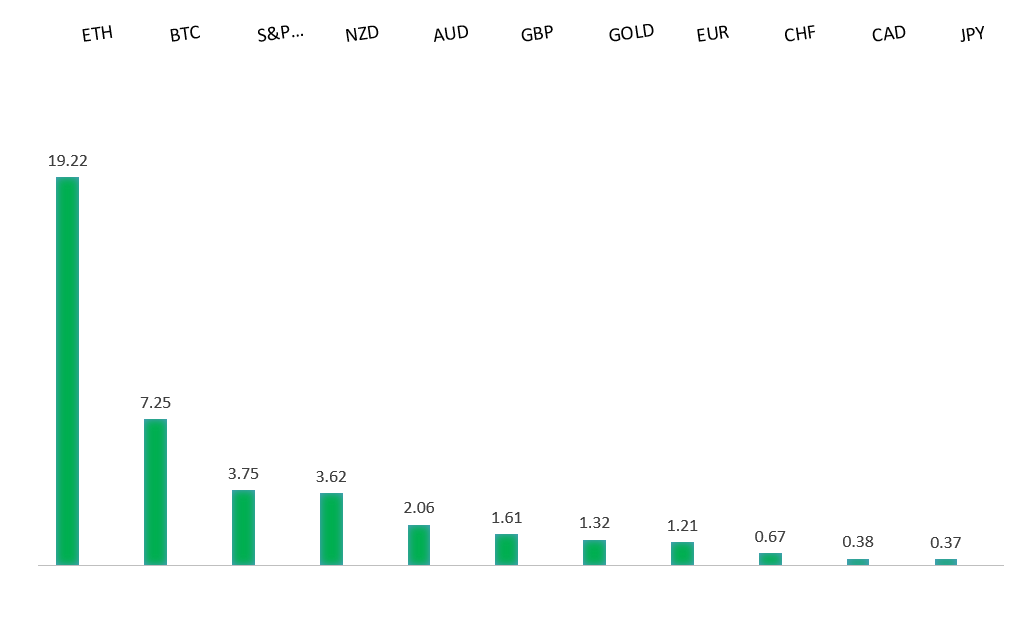
Peformance chart: 30-Day Performance vs. US dollar (%)
Suggested reading
- This Is Still the Early Stages of the AI Investment Boom, S. McBride, RiskHedge (May 28, 2024)
- If Perception Mirrors Reality, We're In Trouble, J. Calhoun, Alhambra (May 27, 2024)
Chart talk: Technical & fundamental highlights
Choose pair:
EURUSD – technical overview
The Euro has been in a multi-month consolidation since bottoming out in 2022. Setbacks have since been exceptionally well supported on dips below 1.0500, with a higher platform sought out ahead of the next major upside extension. Look for a push through the 2023 high at 1.1276 to strengthen the constructive outlook and extend the recovery run towards 1.2000. Only back below 1.0400 negates.EURUSD – fundamental overview
The market has been unimpressed with the ECB's effort to fine the banks over climate violations, and the Euro has come under added pressure as equities markets turn south. Key standouts on Thursday’s calendar come from Eurozone sentiment, confidence, and unemployment data, Canada earnings, US GDP, US initial jobless claims, US pending home sales, and a round of Fed speak.EURUSD - Technical charts in detail
GBPUSD – technical overview
Signs have emerged of the market wanting to put in a longer-term base after collapsing to a record low in September 2022. The latest push to a fresh 2024 high beyond 1.2830 confirms the outlook and opens the door for the next major upside extension towards the 2023 high at 1.3143. Any setbacks should now be well supported ahead of 1.2000.GBPUSD – fundamental overview
Most of the latest setbacks in the Pound have been about developments on the US side, with the Dollar rallying across the board on stronger US economic data, lower equities, and a repricing of Fed cut bets that now sees just 28 basis points of cuts in 2024. Key standouts on Thursday’s calendar come from Eurozone sentiment, confidence, and unemployment data, Canada earnings, US GDP, US initial jobless claims, US pending home sales, and a round of Fed speak.USDJPY – technical overview
The market remains confined to a strong uptrend, most recently extending to a multi-year high through 160.00. Key support comes in at 151.95, with only a weekly close below to delay the constructive outlook.USDJPY – fundamental overview
The Yen has been in demand for a change on this Thursday, despite broad based Dollar gains and yield differentials that continue to lean decidedly in the US Dollar's favor. It's possible, the Yen demand is coming from traditional correlations with risk sentiment. Stocks have been under pressure and investor appetite for risk has faded. Key standouts on Thursday’s calendar come from Eurozone sentiment, confidence, and unemployment data, Canada earnings, US GDP, US initial jobless claims, US pending home sales, and a round of Fed speak.AUDUSD – technical overview
There are signs of the potential formation of a longer-term base with the market trading down into a meaningful longer-term support zone. Only a monthly close below 0.6200 would give reason for rethink. Back above 0.6900 will take the big picture pressure off the downside and strengthen case for a bottom.AUDUSD – fundamental overview
The Australian Dollar has been in cool down mode, mostly on the back of this latest wave of risk off flow resulting in downside pressure on global equities. Economic data out of Australia earlier today was mixed. Private capex came in better than expected, though housing data and plant machinery capex were disappointing. Key standouts on Thursday’s calendar come from Eurozone sentiment, confidence, and unemployment data, Canada earnings, US GDP, US initial jobless claims, US pending home sales, and a round of Fed speak.USDCAD – technical overview
Above 1.3000 signals an end to a period of longer-term bearish consolidation and suggests the market is in the process of carving out a more significant longer-term base. Next key resistance now comes in up into the 1.4000 area. Setbacks should be very well supported down into the 1.3000 area.USDCAD – fundamental overview
A surging US Dollar has cleared weighed on the commodities complex, with the Canadian Dollar suffering as a result. Key standouts on Thursday’s calendar come from Eurozone sentiment, confidence, and unemployment data, Canada earnings, US GDP, US initial jobless claims, US pending home sales, and a round of Fed speak.NZDUSD – technical overview
Overall pressure remains on the downside with the market continuing to stall out on runs up into the 0.6500 area. At the same time, there are some signs of the market wanting to put in a longer-term base. Ultimately, a break back above 0.6500 would be required to take the medium-term pressure off the downside and encourage this prospect. A monthly close below 0.5800 will intensify bearish price action.NZDUSD – fundamental overview
A New Zealand budget deficit of NZD $13.4 billion has been forecast for the fiscal year ending June 30, 2024, though this is then seen narrowing and returning to a surplus of NZD $1.5 billion in 2027-28. The outlook for GDP growth has been downwardly revised in the budget, which points to rising unemployment. Key standouts on Thursday’s calendar come from Eurozone sentiment, confidence, and unemployment data, Canada earnings, US GDP, US initial jobless claims, US pending home sales, and a round of Fed speak.US SPX 500 – technical overview
Longer-term technical studies continue to look quite extended, begging for a deeper correction ahead. At the same time, the latest bullish breakout to a fresh record high beyond the 2024 high opens the door for the next measured move upside extension targeting the 5650 area. Key support comes in at 4928.US SPX 500 – fundamental overview
Though we have seen a healthy adjustment of investor expectations towards the amount of rate cuts in 2024, the market still hopes policy will end up erring more towards the investor friendly, accommodative side of things. This bet has kept stocks well bid into dips and consistently pushing record highs. Still, if there is a sense the Fed will need to be more sensitive towards erring on the side of higher rates, it could invite major disruption to the stock market.GOLD (SPOT) – technical overview
The 2019 breakout above the 2016 high at 1375 was a significant development, opening the door for fresh record highs and this next major upside extension into the 2500-3000 area. Setbacks should now be well supported above 2000 on a monthly close basis.GOLD (SPOT) – fundamental overview
The yellow metal has pushed record highs in 2024 with solid demand from medium and longer-term accounts. These players are more concerned about inflation, geopolitical risk and a less upbeat global growth outlook. All of this should keep the commodity well supported, with many market participants also fleeing to the hard asset as the grand dichotomy of record high equities and record low yields comes to an end.