


Today’s report: Mild risk on flow in holiday thin trade
We’re not expecting too much in the way of market activity this week, with most traders still off the desks until next week. What we have seen as the week gets going is a moderate pickup in risk appetite.
Wake-up call
- ECB speak
- UK pensions
- BOJ Kuroda
- loan repayments
- Canada resilience
- investor appetite
- Inflation headache
- Dealers report
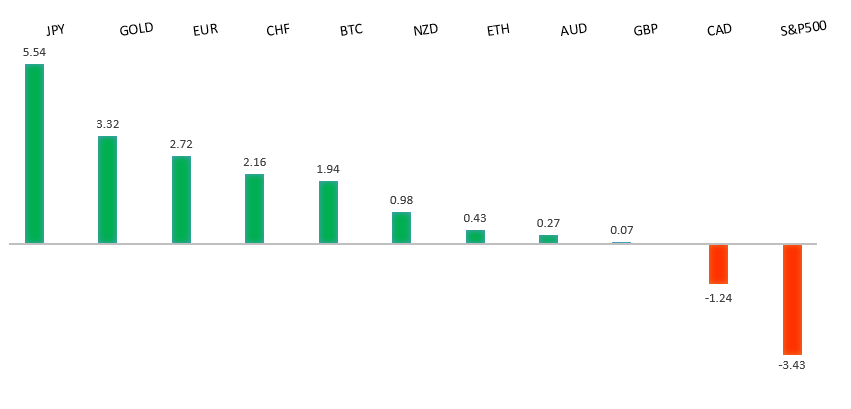
Peformance chart: 30 Day Performance vs. US dollar (%)
Suggested reading
- India and China — a 2023 Tale of Two Markets, A. Mukherjee, Bloomberg (December 26, 2022)
- Private Equity Facing Antitrust Showdown, S. Palma, Financial Times (December 22, 2022)
Chart talk: Technical & fundamental highlights
Choose pair:
EURUSD – technical overview
The Euro recovery has finally run back above meaningful previous support turned resistance at 1.0635. But we'll need to see a monthly close above this level to suggest the market has established a longer-term base. Inability to hold above 1.0635 on a monthly close basis could open the door for a resumption of declines.EURUSD – fundamental overview
ECB Executive Board member Schnabel said interest rates will have to move into “restrictive territory” to bring inflation back to target. Reflecting on the ECB's string of four interest rate hikes, Schnabel said the central bank is doing “whatever is necessary” to bring inflation back to 2%. She echoed the position of ECB President Christine Lagarde, who has said rate increases will continue “for a period of time.” The ECB's tightening cycle has only passed halfway point and needs to be there for longer, the FT reports, citing an interview with Governing Council member Knot. The ECB would achieve “quite a decent pace of tightening” through half percentage point rises in the next several months before borrowing costs eventually peaked by the summer, the risk of us doing too little is still the bigger risk." Looking ahead, there is no first-tier economic data on Tuesday’s docket. The only notable standouts come from second-tier data out of the US.EURUSD - Technical charts in detail
GBPUSD – technical overview
Signs have emerged of the market wanting to put in a longer-term base after collapsing to a record low in September. The latest weekly close back above the September high at 1.1739 strengthens this prospect. Any setbacks should now be well supported ahead of 1.1100. Next key resistance comes in at 1.2668.GBPUSD – fundamental overview
The Pound has been slightly better bid in recent sessions, with Sterling bulls stepping in to defend the 1.2000 psychological barrier. Meanwhile, the Gilt curve has been steepening and there is worry we may not have seen the last of the UK pension Gilt problem. Looking ahead, there is no first-tier economic data on Tuesday’s docket. The only notable standouts come from second-tier data out of the US.USDJPY – technical overview
Longer-term technical studies are in the process of unwinding from severe overbought readings. Look for additional corrective price action back down towards the 126.00 area before the market considers the possibility of uptrend resumption. Rallies should now be well capped ahead of 140.00.USDJPY – fundamental overview
BOJ Governor Kuroda stressed that the bank's latest tweaks on its bond yield control program were not the beginning of an exit of monetary easing, but a way to make it sustainable and run smoothly. “This is definitely not a step toward an exit,” Kuroda said in a speech at an event hosted by business lobby Keidanren on Monday. “The bank will aim to achieve the price stability target in a sustainable and stable manner, accompanied by wage increases, by continuing with monetary easing under the framework of yield curve control.” Looking ahead, there is no first-tier economic data on Tuesday’s docket. The only notable standouts come from second-tier data out of the US.AUDUSD – technical overview
There are signs of the potential formation of a longer-term base following the recent surge back above 0.6500. The latest weekly close back above previous support now turned resistance at 0.6682 strengthens the outlook for a bullish structural shift.AUDUSD – fundamental overview
Some 30% of Australian borrowers on fixed-rate mortgages will see repayments climb by more than 40% when their loans roll over next year, based on the current 3.1% cash rate, a Reserve Bank scenario analysis showed. The analysis was among a swathe of RBA documents devoted to the impact of rising interest rates on the nation's heavily-indebted households that were released under the Freedom of Information Act on Friday. The RBA is closely watching household finances as it rapidly raises rates to rein in inflation. Since the analysis was undertaken in September, the central bank has hiked by the additional 75 basis points discussed in the scenario. Looking ahead, there is no first-tier economic data on Tuesday’s docket. The only notable standouts come from second-tier data out of the US.USDCAD – technical overview
A recent surge back above 1.3000 signals an end to a period of bearish consolidation and suggests the market is in the process of carving out a more significant longer-term base. Next key resistance now comes in up into the 1.4000 area. Setbacks should be very well supported down into the 1.3000 area.USDCAD – fundamental overview
The Canada economy showed signs of resilience toward the end of the year, potentially bolstering the case for the central bank to continue raising borrowing costs. Preliminary data suggest gross domestic product expanded 0.1% in November. That followed a 0.1% gain in October, matching the median estimate in a Bloomberg survey of economists, and an upwardly revised increase of 0.2% in September. The October and November gains suggest Canada's growth is holding up better than expected. The economy is on track to expand at an annualized rate of 1.2% in the fourth quarter. Looking ahead, there is no first-tier economic data on Tuesday’s docket. The only notable standouts come from second-tier data out of the US.NZDUSD – technical overview
Overall pressure remains on the downside with risk for the current recovery rally to stall out and form a lower top for the next major downside extension. A break back above 0.6577 would be required to take the immediate pressure off the downside.NZDUSD – fundamental overview
There hasn't been much going on out of New Zealand in the end of year holiday trade. We have however seen some demand for the New Zealand Dollar in recent sessions on account of renewed broad based investor risk appetite. Looking ahead, there is no first-tier economic data on Tuesday’s docket. The only notable standouts come from second-tier data out of the US.US SPX 500 – technical overview
Longer-term technical studies are in the process of unwinding from extended readings off record highs. Look for rallies to be well capped in favor of lower tops and lower lows. A monthly close back above 4300 will be required at a minimum to take the immediate pressure off the downside. Next major support comes in at 3492.US SPX 500 – fundamental overview
We've finally reached a point in the cycle where the Fed recognizes unanchored inflation expectations pose a greater downside risk than over-tightening. This is significant, as it means less investor friendly monetary policy that risks potential recession in the months ahead. Overall, we expect inflation to continue to be a problem in Q4 2022 and Q1 2023 that results in downside pressure into rallies.GOLD (SPOT) – technical overview
The 2019 breakout above the 2016 high at 1375 was a significant development, opening the door for fresh record highs. Setbacks should now be well supported above 1600 on a monthly close basis ahead of the next major upside extension. This latest break back above 1808 strengthens the bullish outlook.GOLD (SPOT) – fundamental overview
The yellow metal continues to be well supported on dips with solid demand from medium and longer-term accounts. These players are more concerned about inflation risk and a less upbeat global growth outlook. All of this should keep the commodity well supported, with many market participants also fleeing to the hard asset as the grand dichotomy of record high equities and record low yields comes to an unnerving climax.