


Next 24 hours: Euro reverses course on soft data
Today’s report: More downside pressure on the Buck
There wasn’t much going on in Monday trade which was unsurprisingly reflected in the price action. We did see another round of mild but broad-based US Dollar selling, and we did see US equities attempt to push back up after taking a hit on Friday.
Wake-up call
- peak rate
- more taxes
- policy shift
- Ellis resignation
- building permits
- global sentiment
- Inflation headache
- Dealers report
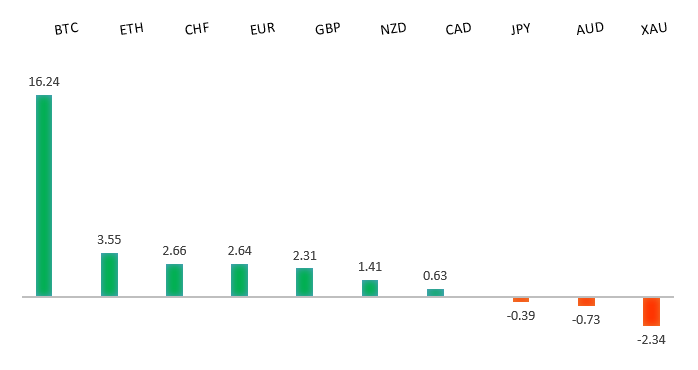
Peformance chart: 30 Day Performance vs. US dollar (%)
Suggested reading
- Swaps Predict Inflation When All Else Comes Up Short, M. Winkler, Bloomberg (July 10, 2023)
- Gautam Adani: the billionaire vs the short seller, T. Griggs, Financial Times (July 10, 2023)
Chart talk: Technical & fundamental highlights
Choose pair:
EURUSD – technical overview
The Euro remains well supported on dips following a run to the topside through 1.1000 earlier this year. Any additional setbacks should be well supported ahead of 1.0500 in favor of the formation of the next major higher low and a bullish continuation. Ultimately, only a monthly close back below 1.0500 would give reason for concern. Next key resistance comes in the form of the March 2022 high at 1.1185.EURUSD – fundamental overview
Implied peak rates in the Eurozone have pushed up towards 4% and the Euro has moved up along with the rate pricing as to be expected. ECB Herodotou helped the Euro along some more after saying he saw tighter policy as the only inflation tool. Eurozone confidence reads were softer but didn't factor much into price action. Key standouts on Tuesday’s calendar come from German inflation, UK employment, German and Eurozone ZEW reads, and a Fed Bullard speech.EURUSD - Technical charts in detail
GBPUSD – technical overview
Signs have emerged of the market wanting to put in a longer-term base after collapsing to a record low in September 2022. The November 2022 monthly close back above 1.2000 strengthens this prospect. Any setbacks should now be well supported ahead of 1.2000. Next key resistance comes in at 1.3000.GBPUSD – fundamental overview
The Pound was an underperformer in Monday trade as PM Sunak urged to raise taxes. Non-government officials were out calling for 'income and wealth' taxes to aid the inflation fight. Key standouts on Tuesday’s calendar come from German inflation, UK employment, German and Eurozone ZEW reads, and a Fed Bullard speech.USDJPY – technical overview
The major pair has seen a nice recovery following the massive correction out from multi-year highs. Setbacks have finally been well supported ahead of 125.00 in the 127s thus far. At this stage, it looks like the market could be wanting to resume the bigger picture uptrend and head back towards a retest of that multi-year high from October 2022 up at 151.95. Look for any weakness to continue to be well supported in favor of higher lows along the way.USDJPY – fundamental overview
There have been more calls of late for a shift in BOJ policy at the upcoming meeting, with many viewing the central bank's ultra accommodative stance as stale and needing of some tweaks that lean more hawkish. We have since seen the Yen benefit in recent sessions as a consequence. Key standouts on Tuesday’s calendar come from German inflation, UK employment, German and Eurozone ZEW reads, and a Fed Bullard speech.AUDUSD – technical overview
There are signs of the potential formation of a longer-term base following the late 2022 surge back above 0.6500. Next key resistance comes in at 0.7284. Setbacks should continue to be well supported in the 0.6500 area. Only a monthly close below 0.6500 would give reason for rethink.AUDUSD – fundamental overview
The Australian Dollar was an underperformer on Monday, unable to focus on much more than all of the shakeup at the RBA. Assistant governor Ellis announced her resignation, following the recent departures of Kearns and Debelle. RBA Lowe is not guaranteed a reappointment to another term and all of this is making the Australian Dollar more nervous. Key standouts on Tuesday’s calendar come from German inflation, UK employment, German and Eurozone ZEW reads, and a Fed Bullard speech.USDCAD – technical overview
Above 1.3000 signals an end to a period of longer-term bearish consolidation and suggests the market is in the process of carving out a more significant longer-term base. Next key resistance now comes in up into the 1.4000 area. Setbacks should be very well supported down into the 1.3000 area.USDCAD – fundamental overview
The Canadian Dollar didn't do much at all on Monday, but was able to consolidate recent gains after Canada building permits came in strong. Key standouts on Tuesday’s calendar come from German inflation, UK employment, German and Eurozone ZEW reads, and a Fed Bullard speech.NZDUSD – technical overview
Overall pressure remains on the downside with the market once again stalling out on a run up into the 0.6500 area. Ultimately, a break back above 0.6577 would be required to take the immediate pressure off the downside. A monthly close below 0.6000 would intensify bearish price action.NZDUSD – fundamental overview
The New Zealand Dollar was up mildly in Monday trade, mostly tracking along with US equities and global sentiment. Key standouts on Tuesday’s calendar come from German inflation, UK employment, German and Eurozone ZEW reads, and a Fed Bullard speech.US SPX 500 – technical overview
Longer-term technical studies are in the process of unwinding from extended readings off record highs. Look for rallies to be well capped in favor of lower tops and lower lows. A monthly close back above 4400 will be required to take the immediate pressure off the downside. Next key support comes in at 4260.US SPX 500 – fundamental overview
We've finally reached a point in the cycle where the Fed recognizes unanchored inflation expectations pose a greater downside risk than over-tightening. This is significant, as it means less investor friendly monetary policy that risks potential recession in the months ahead. Overall, we expect inflation to continue to be a problem in 2023 that results in downside pressure into rallies despite market expectations that would argue otherwise.GOLD (SPOT) – technical overview
The 2019 breakout above the 2016 high at 1375 was a significant development, opening the door for fresh record highs. Setbacks should now be well supported above 1600 on a monthly close basis ahead of the next major upside extension. The recent break back above 1808 strengthens the bullish outlook. Next major resistance comes in at 2100, above which opens the next extension towards 2,500.GOLD (SPOT) – fundamental overview
The yellow metal continues to be well supported on dips with solid demand from medium and longer-term accounts. These players are more concerned about inflation risk and a less upbeat global growth outlook. All of this should keep the commodity well supported, with many market participants also fleeing to the hard asset as the grand dichotomy of record high equities and record low yields comes to an unnerving climax.