


Next 24 hours: USD declines may come to a halt
Today’s report: Nothing like soft data to prop stocks
Monday’s round of economic data out of the US wasn’t pretty, with home sales down for the 6th time in 7 months and Dallas Fed manufacturing missing by the most in 17 months.
Wake-up call
- import prices
- All quiet
- two-way flow
- COVID spread
- refineries
- selling interest
- Stocks vulnerable
- Dealers report
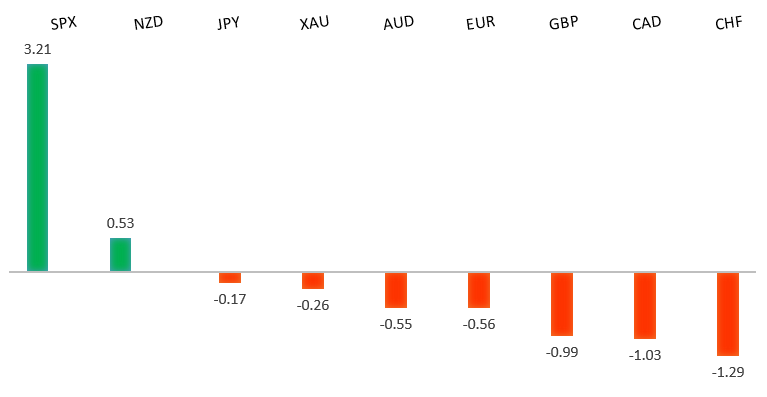
Peformance chart: 30 Day Performance vs. US dollar (%)
Suggested reading
- Jobs Are Jerome Powell’s Number One Job, B. Dudley, Bloomberg (August 30, 2021)
- The Fed is Tone Deaf to Sound Money, T. Regan, American Consequences (August 28, 2021)
Chart talk: Technical & fundamental highlights
Choose pair:
EURUSD – technical overview
The market has been looking for a higher low since topping out in 2021 up at 1.2350. Ideally, setbacks continue to be well supported down towards 1.1600 in favour of the next major upside extension back through 1.2350 and towards a retest of the 2018 high at 1.2555 further up. Only a weekly close below 1.1600 would force a rethink.EURUSD – fundamental overview
No major surprises from Eurozone confidence reads and German inflation data on Monday. ECB Villeroy was on the wires saying the EU would lag the US recovery, suggesting there was no rush to change PEPP at next week's meeting. Key standouts on Tuesday’s calendar come in the form of Japanese employment and industrial production, Aussie building permits and private sector credit, German unemployment, BOE consumer credit, Eurozone inflation, Canada GDP, US housing data, and Chicago PMIs.EURUSD - Technical charts in detail
GBPUSD – technical overview
The market is in a corrective phase in the aftermath of the run to fresh 2021 and multi-month highs. At this stage, additional setbacks should be limited to the 1.3500 area ahead of the next major upside extension towards a retest and break of critical resistance in the form of the 2018 high.GBPUSD – fundamental overview
Very little activity out of the Pound on Monday, with the market mostly trading sideways and waiting for more from Tuesday's calendar. Key standouts on Tuesday’s calendar come in the form of Japanese employment and industrial production, Aussie building permits and private sector credit, German unemployment, BOE consumer credit, Eurozone inflation, Canada GDP, US housing data, and Chicago PMIs.USDJPY – technical overview
The longer-term trend is bearish despite the recent run higher. Look for additional upside to be limited, with scope for a topside failure and bearish resumption back down towards the 100.00 area. It would take a clear break back above 113.00 to negate the outlook.USDJPY – fundamental overview
Japanese retail sales data cooled off on Monday, though did manage to come in a healthy amount above forecast. We continue to see decent two way flow here, with demand for Yen on broad based US Dollar selling and offers in the Yen on ongoing record highs in US equities. Key standouts on Tuesday’s calendar come in the form of Japanese employment and industrial production, Aussie building permits and private sector credit, German unemployment, BOE consumer credit, Eurozone inflation, Canada GDP, US housing data, and Chicago PMIs.AUDUSD – technical overview
The Australian Dollar has been in the process of a healthy correction following the impressive run towards a retest of the 2018 high earlier this year. At this stage, there is risk for additional declines, though setbacks are expected to be well supported down into the 0.7000 area.AUDUSD – fundamental overview
Another run to record highs in US stocks didn't do much help for the Australian Dollar on Monday, with the currency hit on news of the record COVID spread and potential Q2 contraction. Key standouts on Tuesday’s calendar come in the form of Japanese employment and industrial production, Aussie building permits and private sector credit, German unemployment, BOE consumer credit, Eurozone inflation, Canada GDP, US housing data, and Chicago PMIs.USDCAD – technical overview
Finally signs of a major bottom in the works after a severe decline from the 2020 high. A recent weekly close back above 1.2500 encourages the constructive outlook and opens the door for a push back towards next critical resistance in the 1.3000 area. Any setbacks should be well supported into the 1.2200s.USDCAD – fundamental overview
The Canadian Dollar managed to find mild demand on Monday, despite the news of the largest drop in consumer confidence in over a year. It seems other headlines around Gulf Coast refineries unharmed by Hurricane Ida, and the current account surplus exceeding expectations were enough to offset selling pressure on the Loonie. Key standouts on Tuesday’s calendar come in the form of Japanese employment and industrial production, Aussie building permits and private sector credit, German unemployment, BOE consumer credit, Eurozone inflation, Canada GDP, US housing data, and Chicago PMIs.NZDUSD – technical overview
The market has entered a period of consolidation after running up to a yearly and multi-month high. At this stage, there is still room for deeper setbacks into the 0.6500-0.6800 area before we see an attempt at a higher low and resumption of upside pressure.NZDUSD – fundamental overview
Not much to report out of New Zealand into Tuesday. We have seen the Kiwi recovery running into resistance, perhaps on the ongoing worry around the coronavirus spread. Key standouts on Tuesday’s calendar come in the form of Japanese employment and industrial production, Aussie building permits and private sector credit, German unemployment, BOE consumer credit, Eurozone inflation, Canada GDP, US housing data, and Chicago PMIs.US SPX 500 – technical overview
Longer-term technical studies are looking quite exhausted and the market is showing signs of wanting to roll over after racing to another record high. Look for rallies to be well capped above 4500, with a break back below 4353 to strengthen the outlook.US SPX 500 – fundamental overview
We're trading just off fresh record highs, and yet, with so little room for additional central bank accommodation, given an already depressed interest rate environment, the prospect for sustainable runs to the topside on easy money policy incentives and government stimulus, should no longer be as enticing to investors. Meanwhile, ongoing worry associated with coronavirus fallout and risk of rising inflation should weigh more heavily on investor sentiment into the second half of 2021.GOLD (SPOT) – technical overview
The 2019 breakout above the 2016 high at 1375 was a significant development, opening the door for fresh record highs and an acceleration beyond the next major psychological barrier at 2000. Setbacks should now be well supported above 1600.GOLD (SPOT) – fundamental overview
The yellow metal continues to be well supported on dips with solid demand from medium and longer-term accounts. These players are more concerned about exhausted monetary policy, extended global equities, and coronavirus fallout. All of this should keep the commodity well supported, with many market participants also fleeing to the hard asset as the grand dichotomy of record high equities and record low yields comes to an unnerving climax.