


Special report: Fed Minutes Preview
Today’s report: Plenty of event risk on Wednesday
Diffused geopolitical tension around Russia and the Ukraine has done a good job helping to prop investor sentiment back up into the mid-week. And perhaps, the market has also been relieved by the fact that there were no surprise rate hikes from the Fed earlier this week.
Wake-up call
- German ZEW
- UK jobs
- stocks recover
- China measures
- housing data
- COVID spread
- Stocks vulnerable
- Dealers report
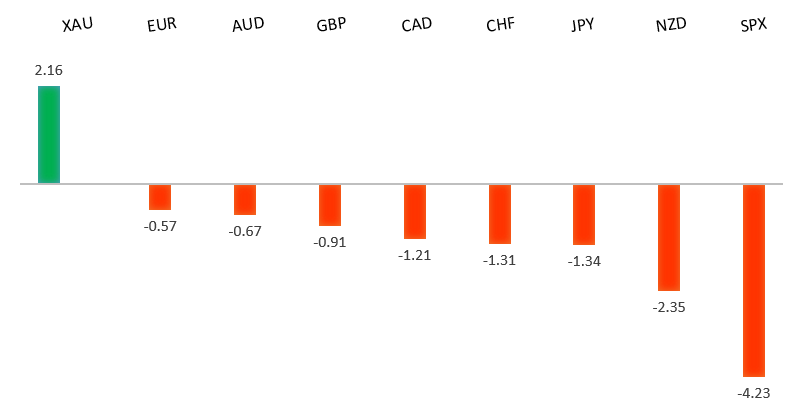
Peformance chart: 30 Day Performance vs. US dollar (%)
Suggested reading
- Quant Momentum Strategy Is Being Maligned Unfairly, A. Brown, Bloomberg (February 16, 2022)
- Is the Federal Reserve Really Clairvoyant?, J. Cochrane, The Grumpy Economist (February 11, 2022)
Chart talk: Technical & fundamental highlights
Choose pair:
EURUSD – technical overview
Setbacks have been well supported below 1.1200, with the market sharply reversing course and pushing back towards the yearly high. A clear break back above 1.1500 will suggest the market could be getting ready to turn back up. Inability to sustain above 1.1500 will keep the pressure on the downside.EURUSD – fundamental overview
The Euro got a boost in Tuesday trade from an easing of geopolitical tension around Russia and the Ukraine, and on the back of solid economic data. Key standouts on today’s calendar come in the form of UK inflation data, Eurozone industrial production, Canada inflation, US retail sales, US industrial production, US business inventories, and the Fed Minutes late in the day.EURUSD - Technical charts in detail
GBPUSD – technical overview
The market is in a correction phase in the aftermath of the run to fresh multi-month highs in 2021. At this stage, additional setbacks should be limited to the 1.3000 area ahead of the next major upside extension towards a retest and break of critical resistance in the form of the 2018 high. Back above 1.3835 takes pressure off the downside.GBPUSD – fundamental overview
The Pound wasn't much of a mover on Tuesday, though we did see some demand from the better than expected UK jobs data. Key standouts on today’s calendar come in the form of UK inflation data, Eurozone industrial production, Canada inflation, US retail sales, US industrial production, US business inventories, and the Fed Minutes late in the day.USDJPY – technical overview
The longer-term trend is bearish despite the recent run higher. Look for additional upside to be limited, with scope for a topside failure and bearish resumption back down towards the 100.00 area. It would take a clear break back above 117.00 to negate the outlook.USDJPY – fundamental overview
The latest round of setbacks in the Yen have been driven by a recovery in risk sentiment and softer Japan GDP numbers. Key standouts on today’s calendar come in the form of UK inflation data, Eurozone industrial production, Canada inflation, US retail sales, US industrial production, US business inventories, and the Fed Minutes late in the day.AUDUSD – technical overview
The Australian Dollar has been in the process of a healthy correction following the impressive run towards a retest of the 2018 high in 2021. At this stage, the correction is starting to look stretched and setbacks should be well supported above 0.7000 on a weekly close basis. A weekly close below 0.7000 will force a bearish shift.AUDUSD – fundamental overview
The Australian Dollar has been getting help from China's latest easing measures and injections of liquidity. The recovery in global risk sentiment has also been a prop to the commodity currency. Key standouts on today’s calendar come in the form of UK inflation data, Eurozone industrial production, Canada inflation, US retail sales, US industrial production, US business inventories, and the Fed Minutes late in the day.USDCAD – technical overview
Finally signs of a major bottom in the works after a severe decline from the 2020 high. A recent weekly close back above 1.2500 encourages the constructive outlook and opens the door for a push back towards next critical resistance in the 1.3000 area. Any setbacks should be well supported into the 1.2200s.USDCAD – fundamental overview
The Canadian Dollar has been underperforming against its peers on signs of a slower housing market. Canada housing starts just came in at their lowest levels since October of 2020. Meanwhile, the PM's invocation of the Emergencies Act hasn't done anything to help sentiment towards the Canadian Dollar. Key standouts on today’s calendar come in the form of UK inflation data, Eurozone industrial production, Canada inflation, US retail sales, US industrial production, US business inventories, and the Fed Minutes late in the day.NZDUSD – technical overview
Setbacks have intensified in recent weeks with the market trading down to fresh multi-month lows. A recent breakdown below the 0.6700 area opens the door for a drop towards 0.6500 in the sessions ahead.NZDUSD – fundamental overview
The New Zealand Dollar hasn't been able to generate much interest from the rebound in risk sentiment, with the currency weighed down by weak housing data and a spread of COVID cases. Key standouts on today’s calendar come in the form of UK inflation data, Eurozone industrial production, Canada inflation, US retail sales, US industrial production, US business inventories, and the Fed Minutes late in the day.US SPX 500 – technical overview
Longer-term technical studies are in the process of unwinding from extended readings off record highs. The latest breakdown below 4,272 opens the door for the next major downside extension towards 3,500. Back above 4,612 will be required at a minimum to take the immediate pressure off the downside.US SPX 500 – fundamental overview
With so little room for additional central bank accommodation, given an already depressed interest rate environment, the prospect for sustainable runs to the topside on easy money policy incentives and government stimulus, should no longer be as enticing to investors. Meanwhile, ongoing worry associated with coronavirus fallout and risk of rising inflation should weigh more heavily on investor sentiment in Q1 2022.GOLD (SPOT) – technical overview
The 2019 breakout above the 2016 high at 1375 was a significant development, opening the door for fresh record highs and an acceleration beyond the next major psychological barrier at 2000. Setbacks should now be well supported above 1700.GOLD (SPOT) – fundamental overview
The yellow metal continues to be well supported on dips with solid demand from medium and longer-term accounts. These players are more concerned about exhausted monetary policy, extended global equities, and coronavirus fallout. All of this should keep the commodity well supported, with many market participants also fleeing to the hard asset as the grand dichotomy of record high equities and record low yields comes to an unnerving climax.