


Next 24 hours: Eurozone, UK PMI reads come in soft
Today’s report: Rating agency downgrades stall market rally
Risk assets traded with a mixed tone on Tuesday. On the one hand, we saw appetite improve on stabilization efforts out of China and optimism around US tech earnings. On the other hand, bank shares were weighed down by an S&P downgrade.
Wake-up call
- current account
- Government borrowing
- JGB yields
- China efforts
- macro factors
- retail sales
- inflation risk
- Dealers report
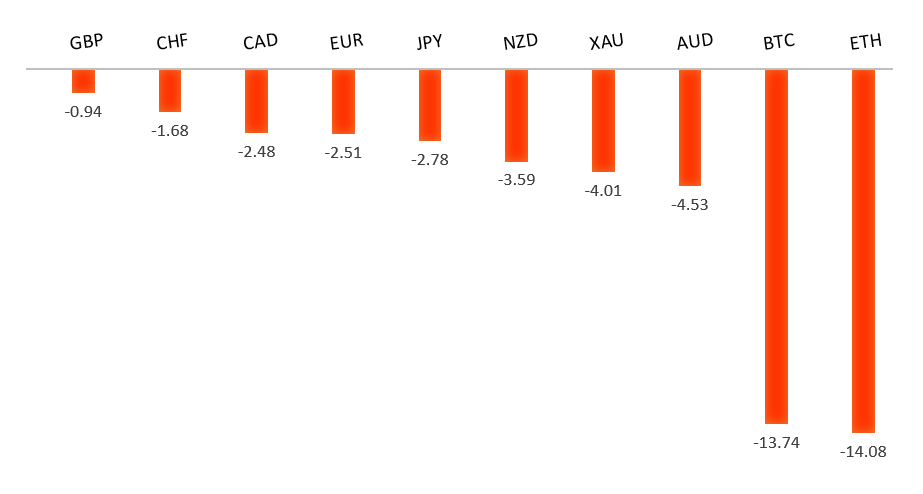
Peformance chart: 30 Day Performance vs. US dollar (%)
Suggested reading
- China Needs Its Own Lehman Moment — Now, S. Ren, Bloomberg (August 22, 2023)
- Biodiversity Funds Spring Up in the Investor Market, A. Ross, FT Alphaville (August 21, 2023)
Chart talk: Technical & fundamental highlights
Choose pair:
EURUSD – technical overview
The Euro remains well supported on dips following a run to the topside through 1.1000. Any additional setbacks should be well supported ahead of 1.0500 in favor of a bullish continuation. Ultimately, only a monthly close back below 1.0500 would give reason for concern. Next key resistance comes in the form of the 2023 high at 1.1276.EURUSD – fundamental overview
The Euro was unable to hold onto gains from a solid ECB current account reading, instead focusing on rising US rates and yield differentials pushing back in the Buck's favor. Key standouts on Wednesday’s calendar come from New Zealand retail sales, German, Eurozone, and UK PMI reads, Canada retail sales, Eurozone consumer confidence, US PMI reads, and US new home sales.EURUSD - Technical charts in detail
GBPUSD – technical overview
Signs have emerged of the market wanting to put in a longer-term base after collapsing to a record low in September 2022. The November 2022 monthly close back above 1.2000 strengthens this prospect. Any setbacks should now be well supported ahead of 1.2500. Next key resistance comes in at 1.3143.GBPUSD – fundamental overview
UK public borrowing data wasn't as bad as expected on Tuesday, which helped to keep the Pound propped up into dips. Key standouts on Wednesday’s calendar come from New Zealand retail sales, German, Eurozone, and UK PMI reads, Canada retail sales, Eurozone consumer confidence, US PMI reads, and US new home sales.USDJPY – technical overview
At this stage, it looks like the market is wanting to resume the bigger picture uptrend and head back towards a retest of that multi-year high from October 2022 up at 151.95. Look for any weakness to continue to be well supported on dips.USDJPY – fundamental overview
JGB yields have run to nine year highs and there is increased pressure on the BOJ to need to contend with rising inflation. This has opened the door to some mild profit taking on Yen short positions. Key standouts on Wednesday’s calendar come from New Zealand retail sales, German, Eurozone, and UK PMI reads, Canada retail sales, Eurozone consumer confidence, US PMI reads, and US new home sales.AUDUSD – technical overview
There are signs of the potential formation of a longer-term base following the late 2022 surge back above 0.6500. Next key resistance comes in at 0.7284. Setbacks should continue to be well supported ahead of 0.6300. Only a monthly close below 0.6400 would give reason for rethink.AUDUSD – fundamental overview
The Australian Dollar has been getting some help out from yearly lows on the back of positive moves out of China. At the same time, the rallies have been mild and plenty of selling still exists into rallies. Key standouts on Wednesday’s calendar come from New Zealand retail sales, German, Eurozone, and UK PMI reads, Canada retail sales, Eurozone consumer confidence, US PMI reads, and US new home sales.USDCAD – technical overview
Above 1.3000 signals an end to a period of longer-term bearish consolidation and suggests the market is in the process of carving out a more significant longer-term base. Next key resistance now comes in up into the 1.4000 area. Setbacks should be very well supported down into the 1.3000 area.USDCAD – fundamental overview
A worsening global macro condition, selling in the price of oil, and softer Canada economic data have factored into the latest run of Canadian Dollar weakness. Key standouts on Wednesday’s calendar come from New Zealand retail sales, German, Eurozone, and UK PMI reads, Canada retail sales, Eurozone consumer confidence, US PMI reads, and US new home sales.NZDUSD – technical overview
Overall pressure remains on the downside with the market once again stalling out on a run up into the 0.6500 area. Ultimately, a break back above 0.6577 would be required to take the immediate pressure off the downside. A monthly close below 0.6000 would intensify bearish price action.NZDUSD – fundamental overview
The New Zealand Dollar has been doing its best to recover out from yearly lows, getting a boost on China actions and a recovery in US equities. Key standouts on Wednesday’s calendar come from New Zealand retail sales, German, Eurozone, and UK PMI reads, Canada retail sales, Eurozone consumer confidence, US PMI reads, and US new home sales.US SPX 500 – technical overview
Longer-term technical studies are in the process of unwinding from extended readings off record highs. Look for rallies to be well capped in favor of lower tops and lower lows. A monthly close back above 4600 will be required to take the immediate pressure off the downside. Next key support comes in at 4328.US SPX 500 – fundamental overview
We've finally reached a point in the cycle where the Fed recognizes unanchored inflation expectations pose a greater downside risk than over-tightening. This is significant, as it means less investor friendly monetary policy. Overall, we expect inflation to continue to be a problem in 2023 that results in downside pressure into rallies despite market expectations that would argue otherwise.GOLD (SPOT) – technical overview
The 2019 breakout above the 2016 high at 1375 was a significant development, opening the door for fresh record highs. Setbacks should now be well supported above 1600 on a monthly close basis ahead of the next major upside extension. Next major resistance comes in at 2100, above which opens the next extension towards 2500.GOLD (SPOT) – fundamental overview
The yellow metal continues to be well supported on dips with solid demand from medium and longer-term accounts. These players are more concerned about inflation risk and a less upbeat global growth outlook. All of this should keep the commodity well supported, with many market participants also fleeing to the hard asset as the grand dichotomy of record high equities and record low yields comes to an unnerving climax.