


Next 24 hours: Getting ready for the Fed Minutes
Today’s report: RBNZ cuts 50 and signals more to come
The New Zealand Dollar was already suffering from a heavy hit to commodities on Tuesday before taking another hit earlier today after the RBNZ came out and slashed rates 50 basis points while accompanying the decision with a signal of more rate cuts ahead.
Wake-up call
- GDP outlook
- budget concerns
- base salaries
- stimulus letdown
- oil collapse
- more cuts
- accommodative policy
- Macro themes
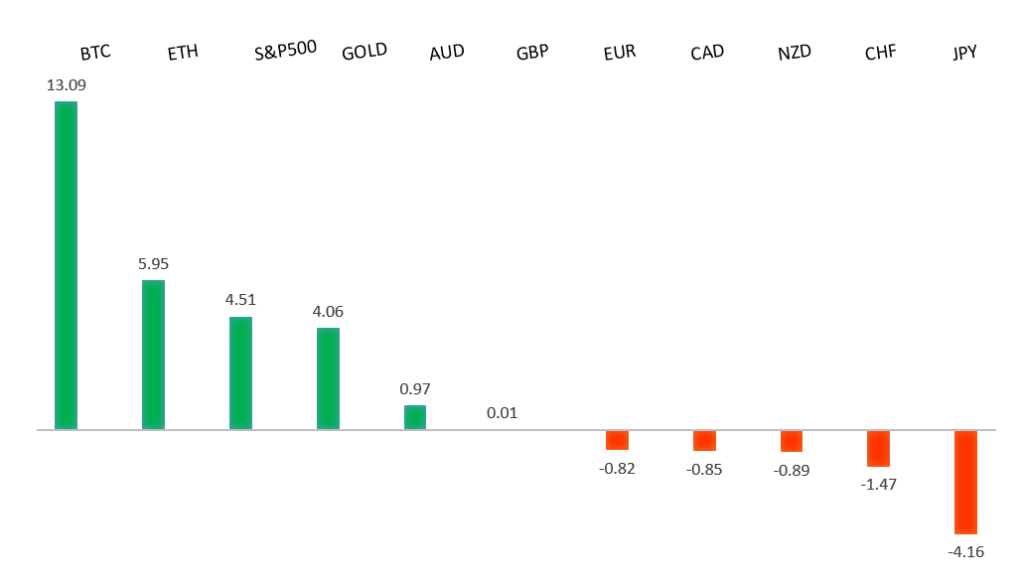
Peformance chart: 30-Day Performance vs. US dollar (%)
Suggested reading
- These Billionaires Have Never Missed Forbes 400 List, S. Young, Forbes (October 5, 2024)
- Can We Combat Overfishing?, S. Savage, Financial Times (October 9, 2024)
Chart talk: Technical & fundamental highlights
Choose pair:
EURUSD – technical overview
The Euro has been in a multi-month consolidation since bottoming out in 2022. Setbacks have since been exceptionally well supported on dips below 1.0500, with a higher platform sought out ahead of the next major upside extension. Look for a push through the 2023 high at 1.1276 to strengthen the constructive outlook and extend the recovery run towards 1.2000. Only back below 1.0400 negates.EURUSD – fundamental overview
The Euro hasn't done much in recent sessions and a lot of the focus is on an easing of front end rates ahead of today's German government updated GDP outlook which many believe will be a negative number. Other key standouts on Wednesday’s calendar come from German trade, Fed speak, and the Fed Minutes late in the day.EURUSD - Technical charts in detail
GBPUSD – technical overview
Signs have emerged of the market wanting to put in a longer-term base after collapsing to a record low in September 2022. The door is now open for the next major upside extension towards the 2018 high at 1.4377. Any setbacks should be well supported ahead of 1.2500.GBPUSD – fundamental overview
There hasn't been much news out of the UK in recent sessions and the Pound has been confined to some tighter ranges as a consequence. But there are some unpleasant budget realities that hang over the UK currency, which could weigh in the sessions ahead, particularly if stop-losses are threatened below 1.3000. Key standouts on Wednesday’s calendar come from German trade, Fed speak, and the Fed Minutes late in the day.USDJPY – technical overview
The market has entered a period of correction after extending the uptrend to a multi-year high through 160.00. Critical support comes in around 140.00, with only a monthly close below the barrier to compromise the bullish outlook. A higher low is ideally sought out above 140.00 in favor of a bullish continuation. A weekly close back above 150.00 will hint at the start to longer-term uptrend resumption.USDJPY – fundamental overview
Mild carry trade unwind and firmer Japan wage data this week have managed to slow the pace of the latest renewed bout of Yen selling. Japan base salaries rose at a record pace in August. Key standouts on Wednesday’s calendar come from German trade, Fed speak, and the Fed Minutes late in the day.AUDUSD – technical overview
There are signs of the potential formation of a longer-term base with the market trading down into a meaningful longer-term support zone. Only a monthly close below 0.6200 would give reason for rethink. A monthly close back above 0.7000 will take the big picture pressure off the downside and strengthen case for a bottom.AUDUSD – fundamental overview
The Australian Dollar has been dragged lower in recent sessions on faltering copper and iron ore prices, both down more than 2% on discouraging news out of China relating to fresh stimulus. Key standouts on Wednesday’s calendar come from German trade, Fed speak, and the Fed Minutes late in the day.USDCAD – technical overview
A sustained hold above 1.3000 over the past several months signals an end to a period of longer-term bearish consolidation and suggests the market is in the process of carving out a more significant longer-term base. Next key resistance now comes in up into the 1.4000 area, with a break to open a retest of the 2020 high just ahead of 1.4700. Setbacks should be very well supported down into the 1.3000 area.USDCAD – fundamental overview
The Canadian Dollar was hit hard on Tuesday after Canada trade was in a deficit for a sixth month and commodities prices were slammed across the board including notable declines in the price of oil. Key standouts on Wednesday’s calendar come from German trade, Fed speak, and the Fed Minutes late in the day.NZDUSD – technical overview
Overall pressure remains on the downside with the market continuing to stall out on runs up into the 0.6500 area. At the same time, there are some signs of the market wanting to put in a longer-term base. Ultimately, a break back above 0.6500 would be required to take the medium-term pressure off the downside and encourage this prospect. A monthly close below 0.5800 will intensify bearish price action.NZDUSD – fundamental overview
The New Zealand Dollar was already suffering from a slide in commodities prices before taking an added hit early Wednesday after the RBNZ cut rates by 50 basis point while signaling more cuts ahead given the subdued credit demand and restrictive financial conditions. Key standouts on Wednesday’s calendar come from German trade, Fed speak, and the Fed Minutes late in the day.US SPX 500 – technical overview
The longer term uptrend remains intact and dips continue to be exceptionally well supported. Critical support comes in at 5093, with only a break back below this level to compromise the structure and open the door for a more significant corrective decline. Until then, the focus remains on a continued push to fresh record highs.US SPX 500 – fundamental overview
The US equities market remains exceptionally well supported in 2024 on the back of an ongoing expectation for more rate cuts than less going forward. Investors are feeling better about a soft landing in the US economy and this has also been accompanied by an accommodative adjustment of Fed policy. It will however be important to keep an eye on inflation, bigger picture economic data, US election and geopolitical risk in the weeks and months ahead.GOLD (SPOT) – technical overview
The 2019 breakout above the 2016 high at 1375 was a significant development, opening the door for fresh record highs and this next major upside extension into the 2500-3000 area. Setbacks should now be well supported above 2300 on a monthly close basis.GOLD (SPOT) – fundamental overview
The yellow metal has pushed record highs in 2024 with solid demand from medium and longer-term accounts. These players are more concerned about inflation, geopolitical risk and a less upbeat global growth outlook. All of this should keep the commodity well supported over the coming months.