


Today’s report: Reassurance without limits
Things were mostly quiet on Thursday, short of a little intraday volatility around the ECB decision. Ultimately though, no surprises, with the central bank leaning more to the dovish side.
Wake-up call
- Dovish communication
- UK CBI
- stocks
- export data
- retail sales
- Higher equities
- Stocks vulnerable
- Dealers report
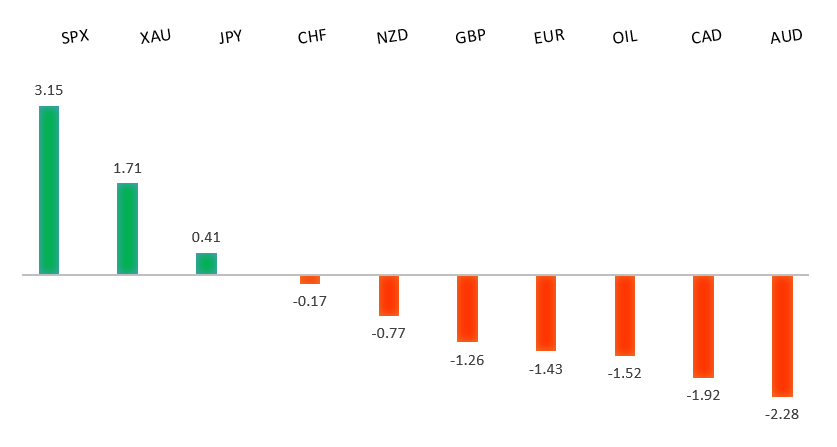
Peformance chart: 30 Day Performance vs. US dollar (%)
Suggested reading
- This Cult Classic Buy Signal Isn't to Be Trusted, J. Authers, Bloomberg (July 22, 2021)
- President Biden’s Net Zero Revolution?, M. McCormick, Financial Times (July 21, 2021)
Chart talk: Technical & fundamental highlights
Choose pair:
EURUSD – technical overview
The market has been looking for a higher low since topping out in 2021 up at 1.2350. Ideally, setbacks continue to be well supported down towards 1.1600 in favour of the next major upside extension back through 1.2350 and towards a retest of the 2018 high at 1.2555 further up. Only a weekly close below 1.1600 would force a rethink.EURUSD – fundamental overview
The Euro was up and down on Thursday, but ultimately settled lower on account of a dovish ECB communication. Softer Eurozone consumer confidence reads only added more downside pressure. Key standouts on Friday’s calendar include UK retail sales, German, Eurozone and UK PMI reads, Canada retail sales, and US manufacturing PMIs.EURUSD - Technical charts in detail
GBPUSD – technical overview
The market is in a corrective phase in the aftermath of the run to fresh 2021 and multi-month highs. At this stage, additional setbacks should be limited to the 1.3500 area ahead of the next major upside extension towards a retest and break of critical resistance in the form of the 2018 high.GBPUSD – fundamental overview
The Pound got a boost on Thursday from UK CBI showing the number of factory workers rising at the fastest rate in almost 50 years. Yield differentials with the Eurozone economy also played into Pound demand as the ECB moved the other way and leaned more dovish. Key standouts on Friday’s calendar include UK retail sales, German, Eurozone and UK PMI reads, Canada retail sales, and US manufacturing PMIs.USDJPY – technical overview
The longer-term trend is bearish despite the recent run higher. Look for additional upside to be limited, with scope for a topside failure and bearish resumption back down towards the 100.00 area. It would take a clear break back above 113.00 to negate the outlook.USDJPY – fundamental overview
Very little activity in the Yen on Thursday, with the currency confined to tighter ranges, waiting for more clarity from the US equities market. Key standouts on Friday’s calendar include UK retail sales, German, Eurozone and UK PMI reads, Canada retail sales, and US manufacturing PMIs.AUDUSD – technical overview
The Australian Dollar has been in the process of a healthy correction following the impressive run towards a retest of the 2018 earlier this year. At this stage, there is risk for additional declines, though setbacks are expected to be well supported down into the 0.7000 area.AUDUSD – fundamental overview
The Australian Dollar extended its recovery on Thursday, getting a little boost from higher US stocks, but also boosted early Thursday on the better than expected Australian export data. Key standouts on Friday’s calendar include UK retail sales, German, Eurozone and UK PMI reads, Canada retail sales, and US manufacturing PMIs.USDCAD – technical overview
Finally signs of a major bottom in the works after a severe decline from the 2020 high. The weekly close back above 1.2500 encourages the constructive outlook and opens the door for a push back towards next critical resistance in the 1.3000 area. Any setbacks should be well supported into the 1.2200s.USDCAD – fundamental overview
Very little activity in the Canadian Dollar on Thursday after some price action earlier in the week. But we'll get some more volatility on Friday with first tier data due out of Canada. Key standouts on Friday’s calendar include UK retail sales, German, Eurozone and UK PMI reads, Canada retail sales, and US manufacturing PMIs.NZDUSD – technical overview
The market has entered a period of consolidation after running up to a yearly and multi-month high. At this stage, there is still room for deeper setbacks into the 0.6500-0.6800 area before we see an attempt at a higher low and resumption of upside pressure.NZDUSD – fundamental overview
Things were more quiet for the New Zealand Dollar on Thursday, though we did see continued recovery out from the recent yearly low on account of higher US equities. Key standouts on Friday’s calendar include UK retail sales, German, Eurozone and UK PMI reads, Canada retail sales, and US manufacturing PMIs.US SPX 500 – technical overview
Longer-term technical studies are looking quite exhausted and the market is showing signs of wanting to roll over after racing to another record high. Look for rallies to be well capped ahead of 4500, with a break back below 4139 to strengthen the outlook.US SPX 500 – fundamental overview
We're trading just off fresh record highs, and yet, with so little room for additional central bank accommodation, given an already depressed interest rate environment, the prospect for sustainable runs to the topside on easy money policy incentives and government stimulus, should no longer be as enticing to investors. Meanwhile, ongoing worry associated with coronavirus fallout and risk of rising inflation should weigh more heavily on investor sentiment into the second half of 2021.GOLD (SPOT) – technical overview
The 2019 breakout above the 2016 high at 1375 was a significant development, opening the door for fresh record highs and an acceleration beyond the next major psychological barrier at 2000. Setbacks should now be well supported above 1600.GOLD (SPOT) – fundamental overview
The yellow metal continues to be well supported on dips with solid demand from medium and longer-term accounts. These players are more concerned about exhausted monetary policy, extended global equities, and coronavirus fallout. All of this should keep the commodity well supported, with many market participants also fleeing to the hard asset as the grand dichotomy of record high equities and record low yields comes to an unnerving climax.