


Today’s report: Reflections on a wacky day of trade
Thursday was certainly a wild day for financial markets and one that could go down as one of the biggest head scratchers in quite some time. US inflation reads were higher across the board, only adding to the case for more rate hikes from the Fed, more risk off flow, and more US Dollar upside.
Wake-up call
- ECB report
- U-turn speculation
- policy divergence
- China outlook
- house prices
- relative strength
- Inflation headache
- Dealers report
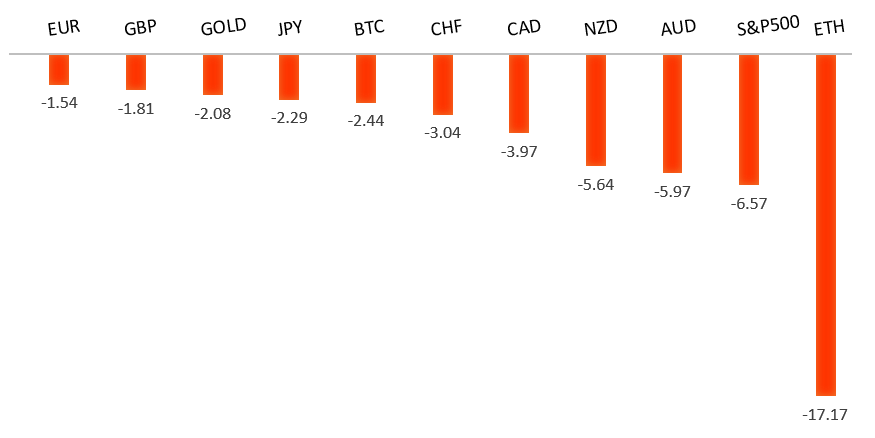
Peformance chart: 30 Day Performance vs. US dollar (%)
Suggested reading
- UK Crisis Is Threatening the Global Inflation Fight, J. Authers, Bloomberg (October 14, 2022)
- Competition for Arms Technology is Ferocious, A. Gross, Financial Times (October 12, 2022)
Chart talk: Technical & fundamental highlights
Choose pair:
EURUSD – technical overview
Technical studies are turning up from oversold territory, suggesting additional setbacks should be limited in favour of some form of a meaningful correction and consolidation. A weekly close back above parity will take the immediate pressure off the downside.EURUSD – fundamental overview
There was some chatter on Thursday around an ECB staff report that said that when combined with a reduction in the balance sheet, rates would only need to increase to 2.25% versus the 3% priced into markets. This was said to inspire risk on flow, which in turn opened selling of the US Dollar and demand for the Euro. We think Euro longs should however be careful here as none of Thursday's developments were on the surface Euro supportive. Key standouts on today’s calendar come from German wholesale prices, Eurozone trade, Canada manufacturing sales, US retail sales, Michigan sentiment, and business inventories.EURUSD - Technical charts in detail
GBPUSD – technical overview
Signs have emerged of the market wanting to put in a longer-term base after collapsing to a record low in September. A break above the September high at 1.1739 will solidify the recovery. Until then, look for setbacks to be well supported ahead of 1.0800.GBPUSD – fundamental overview
The Pound has rallied sharply over the past 24 hours, this on the back of expectations of a U-turn to the UK budget. We also saw some added demand on broad based US Dollar selling, possibly from risk positive news around the ECB report (see Euro commentary). Key standouts on today’s calendar come from German wholesale prices, Eurozone trade, Canada manufacturing sales, US retail sales, Michigan sentiment, and business inventories.USDJPY – technical overview
Technical studies are looking quite stretched on the longer-term chart, warning of consolidation and correction in the days and weeks ahead. Look for additional upside from here to be well capped ahead of 150.00. Next key support comes in at 143.52.USDJPY – fundamental overview
The Yen has extended declines to fresh multi-year low levels, sinking below pre-intervention levels from September. Policy divergence continues to be a big deal here, with yields moving more and more in the US Dollar's favour. Key standouts on today’s calendar come from German wholesale prices, Eurozone trade, Canada manufacturing sales, US retail sales, Michigan sentiment, and business inventories.AUDUSD – technical overview
Overall pressure remains on the downside with the market confined to a well defined downtrend. A break back above 0.6682 would be required to take the pressure off the downside. Until then, scope exists for deeper setbacks towards 0.6000.AUDUSD – fundamental overview
The Australian Dollar has benefitted from this latest wave of risk on flow and broad based US Dollar selling, though remains a relative underperformer on discouraging price action in China markets and heavy metals prices. Key standouts on today’s calendar come from German wholesale prices, Eurozone trade, Canada manufacturing sales, US retail sales, Michigan sentiment, and business inventories.USDCAD – technical overview
A recent surge back above 1.3000 signals an end to a period of bearish consolidation and suggests the market is in the process of carving out a more significant longer-term base. Next key resistance now comes in up into the 1.4000 area. Setbacks should be very well supported down into the 1.3000 area.USDCAD – fundamental overview
The Canadian Dollar has managed a minor recovery after putting in a fresh yearly and multi-month low against the Buck. The price action can be attributed to the risk on flow and broad based US Dollar selling. Having said that, there are concerns about the outlook for the Canada economy, specifically the housing market. The Canada Mortgage and Housing agency sees a 15% decline in home prices and a modest recession ahead. Key standouts on today’s calendar come from German wholesale prices, Eurozone trade, Canada manufacturing sales, US retail sales, Michigan sentiment, and business inventories.NZDUSD – technical overview
Overall pressure remains on the downside with the focus on a retest of the critical low from 2020 at 0.5469. A break back above 0.5814 would be required to take the immediate pressure off the downside.NZDUSD – fundamental overview
The New Zealand Dollar is higher on this Friday, despite a slide in business PMIs. The currency has been getting a lift from this latest wave of risk on flow and broad based selling of the US Dollar. Key standouts on today’s calendar come from German wholesale prices, Eurozone trade, Canada manufacturing sales, US retail sales, Michigan sentiment, and business inventories.US SPX 500 – technical overview
Longer-term technical studies are in the process of unwinding from extended readings off record highs. Look for rallies to be well capped in favor of lower tops and lower lows. Back above 3808 will be required at a minimum to take the immediate pressure off the downside. Next major support comes in around 3200.US SPX 500 – fundamental overview
We've finally reached a point in the cycle where the Fed recognizes unanchored inflation expectations pose a greater downside risk than over-tightening. This is significant, as it means less investor friendly monetary policy that risks potential recession in the months ahead. Overall, we expect inflation to continue to be a problem in 2022 that results in downside pressure into rallies.GOLD (SPOT) – technical overview
The 2019 breakout above the 2016 high at 1375 was a significant development, opening the door for fresh record highs. Setbacks should now be well supported above 1600 on a monthly close basis ahead of the next major upside extension.GOLD (SPOT) – fundamental overview
The yellow metal continues to be well supported on dips with solid demand from medium and longer-term accounts. These players are more concerned about inflation risk and a less upbeat global growth outlook. All of this should keep the commodity well supported, with many market participants also fleeing to the hard asset as the grand dichotomy of record high equities and record low yields comes to an unnerving climax.