


Next 24 hours: Fed enters blackout period ahead of November meeting
Today’s report: Relief rallies few and far between
We haven’t seen much of a relief rally in risk assets as the new week gets going, despite geopolitical tension remaining relatively contained over the weekend. Ultimately, investors understand that geopolitical risk is quite real right now and capable of re-escalating at any moment.
Wake-up call
- producer prices
- BOE Bailey
- BOJ Suzuki
- weak jobs
- retail sales
- economic data
- Geopolitical risk
- Global outlook
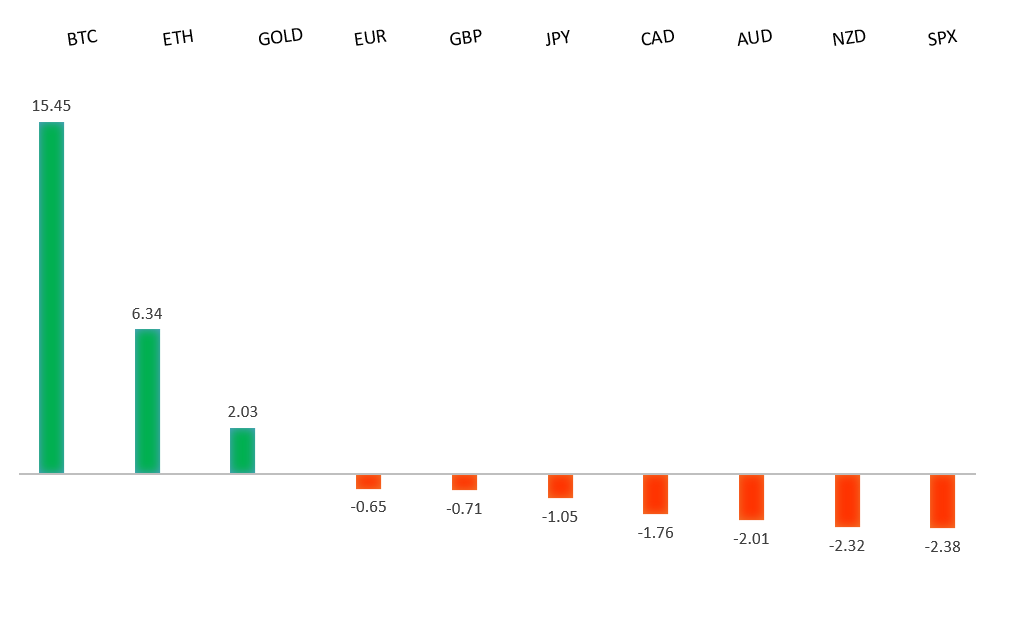
Peformance chart: 30 Day Performance vs. US dollar (%)
Suggested reading
- Housing Prices Are High — and Potentially Illusory, J. Authers, Bloomberg (October 23, 2023)
- The Race for Semiconductor Supremacy, B. Marino, Financial Times (September 28, 2023)
Chart talk: Technical & fundamental highlights
Choose pair:
EURUSD – technical overview
Any additional setbacks should be well supported on dips below 1.0500 in favor of the start to the next major upside extension. Ultimately, only a monthly close back below 1.0500 would give reason for concern. Back above 1.0618 will take the immediate pressure off the downside.EURUSD – fundamental overview
Not much activity in the Euro in recent sessions. German producer prices moderated to -0.2% month over month from 0.3% previous and 0.4% forecast. Monday's economic calendar is exceptionally thin with no first tier data on the docket.EURUSD - Technical charts in detail
GBPUSD – technical overview
Signs have emerged of the market wanting to put in a longer-term base after collapsing to a record low in September 2022. The November 2022 monthly close back above 1.2000 strengthens this prospect. Any setbacks should now be well supported ahead of 1.2000. Next key resistance comes in at 1.3143.GBPUSD – fundamental overview
UK consumer confidence sunk to -30 from -21 previous and -20 forecast, the sharpest decline since the onset of Covid. UK retail sales were also weaker than expected. Meanwhile, BOE Governor Bailey suggested pay growth is still too strong for the BOE target and that UK inflation is likely to 'keep coming down' with expectations for a marked fall. Monday's economic calendar is exceptionally thin with no first tier data on the docket.USDJPY – technical overview
At this stage, it looks like the market is wanting to resume the bigger picture uptrend and head back towards a retest of that multi-year high from October 2022 up at 151.95. Look for any weakness to continue to be well supported on dips.USDJPY – fundamental overview
BOJ Governor Suzuki said it's important FX moves are stable and reflect fundamentals. BoJ Governor Ueda said that the central bank will continue easing to their 2% price goal and stated that uncertainty surrounding the economy and prices remains high. The BOJ announced it would conduct 5-year funds supply operations on October 24 with the aim of keeping yields from surging. Monday's economic calendar is exceptionally thin with no first tier data on the docket.AUDUSD – technical overview
There are signs of the potential formation of a longer-term base with the market trading down into a meaningful longer-term support zone. Only a monthly close below 0.6300 would give reason for rethink. Back above 0.6523 will take the immediate pressure off the downside and strengthen case for a bottom.AUDUSD – fundamental overview
The Australian Dollar has been struggling in recent sessions, taking its hits from broad US Dollar demand, risk off flow, and softer than expected Aussie employment data. Monday's economic calendar is exceptionally thin with no first tier data on the docket.USDCAD – technical overview
Above 1.3000 signals an end to a period of longer-term bearish consolidation and suggests the market is in the process of carving out a more significant longer-term base. Next key resistance now comes in up into the 1.4000 area. Setbacks should be very well supported down into the 1.3000 area.USDCAD – fundamental overview
Canadian August retail sales came in as expected at -0.1% month over month versus 0.3% prior with the ex-auto figure at 0.1% from 1.0% prior and better than the -0.1% expected. Monday's economic calendar is exceptionally thin with no first tier data on the docket.NZDUSD – technical overview
Overall pressure remains on the downside with the market once again stalling out on a run up into the 0.6500 area. Ultimately, a break back above 0.6049 would be required to take the immediate pressure off the downside. A monthly close below 0.5800 would intensify bearish price action.NZDUSD – fundamental overview
It's been a difficult period for the New Zealand Dollar, which has extended declines to fresh yearly lows. The currency has been contending with softer inflation data, a wave of risk off flow in global markets, and this latest widening of the New Zealand trade deficit as exports fell more than imports. Monday's economic calendar is exceptionally thin with no first tier data on the docket.US SPX 500 – technical overview
Longer-term technical studies are in the process of unwinding from extended readings off record highs. Look for rallies to be well capped in favor of lower tops and lower lows. A monthly close back above 4600 will be required to take the immediate pressure off the downside. Next key support comes in at 4200.US SPX 500 – fundamental overview
Investors continue to struggle with the reality of a higher for longer Fed policy track in the face of ongoing worry around inflation, while also contending with an escalation in geopolitical risk. Overall, we expect inflation to continue to be a problem in 2023 that results in downside pressure into rallies despite market expectations that would argue otherwise.GOLD (SPOT) – technical overview
The 2019 breakout above the 2016 high at 1375 was a significant development, opening the door for fresh record highs. Setbacks should now be well supported above 1600 on a monthly close basis ahead of the next major upside extension. Next major resistance comes in at 2100, above which opens the next extension towards 2500.GOLD (SPOT) – fundamental overview
The yellow metal continues to be well supported on dips with solid demand from medium and longer-term accounts. These players are more concerned about inflation risk and a less stable and upbeat global growth outlook. All of this should keep the commodity well supported, with many market participants also fleeing to the hard asset as the grand dichotomy of record high equities and record low yields comes to an unnerving climax.