


LMAX Exchange
We have recently added an extra (optional) call back to the disruptor library. This post will walk through one of our motivations for doing this: monitoring.
Before we start what are we monitoring, and why?
At LMAX Exchange, the vast majority of our applications look a bit like this:
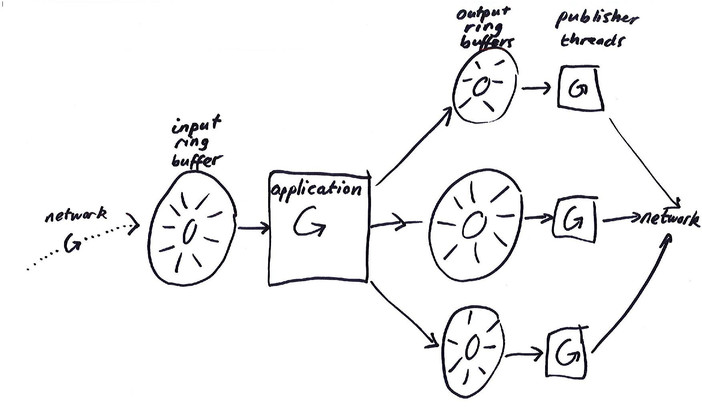
Here, events are received from the network on a single thread, and placed in an input (or application) ring buffer. Another thread (we’ll call it the application thread) processes these messages, and may emplace events in several output (or ‘publisher’) ring buffers. Each of those ring buffers has another thread dedicated to sending those events back out to the network.
Now, the vast majority of the time, everything just works all our applications happily process the input they’ve been given, and the output they produce is handled capably by the publisher threads. Sometimes, however, things go wrong.
Two (eventually) catastrophic failure modes: hosed, and wedged
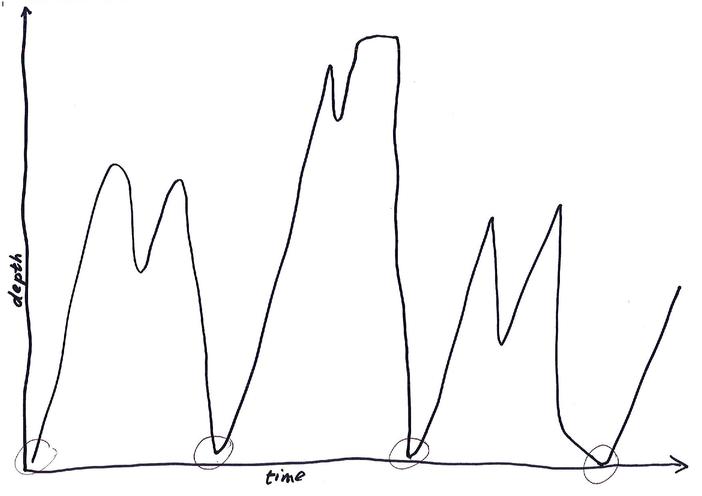
There are probably more agreed terms from queueing theory that we could adhere to, but these are more fun. A hosed system is processing data as fast as it can, but the input rate exceeds its maximum throughput, so its input ring buffer gradually fills up. A wedged system has encountered some sort of problem to cause its throughput to be hugely reduced, or to stop altogether.
Attempt 1: Monitor ringbuffer depth
We can scan the sequence numbers within the ringbuffer and see how far apart our writer and reader threads are.
public final class RingBufferDepthMonitor
{
    private final String ringBufferName;
    private final Cursored writeSequence;
    private final Sequence[] readSequences;
    private final int numberOfReadSequences;

    public RingBufferDepthMonitor(
            final String ringBufferName,
            final Cursored writeSequence,
            final Sequence... readSequences)
    {
        this.ringBufferName = ringBufferName;
        this.writeSequence = writeSequence;
        this.readSequences = readSequences;
        numberOfReadSequences = readSequences.length;
    }

    public long getRingBufferDepth()
    {
        long minimumReadSequence = Long.MAX_VALUE;
        for (int i = 0; i < numberOfReadSequences; i++)
        {
            minimumReadSequence = Math.min(minimumReadSequence, readSequences[i].get());
        }

        return Math.max(0, writeSequence.getCursor() - minimumReadSequence);
    }

    String getRingBufferName()
    {
        return ringBufferName;
    }
}
This is a naive but remarkable effective approach. It can spot most hosing/wedging issues, so long as the interval at which we poll is sufficiently small, and the ringbuffers we are looking at are of reasonable size compared to the input rate.
Note, however, that it is somewhat error prone we can’t read every sequence (this code also works in some applications where there are multiple processing threads) atomically, so we’ll either underestimate or overestimate the depth, depending on the order in which we perform the reads. The choice made in this implementation is left as an exercise to the reader.
It isn’t, from a diagnostic perspective, the most efficient thing we could do. How do we know which of hosed or wedged we are? Well, we need to look at the read and write sequences progression, as well as the depth. We could have created a synthetic ‘depth’ metric derived from those numbers (as we can certainly arrange for them to be monitored near simultaneously) rather than calculating it directly in our applications. We’ve only recently gained the ability to do this (and it’s limited to our alerting tool) though, so this code persists.
The problem with polling
No, not for elections. For monitoring. Perhaps we should say sampling rather than polling, to disambiguate. Anyway. The problem is that sampling will only ever spot problems that have a duration in the same order as the sampling interval.
We can repeatedly tighten the interval for our ringbuffer monitoring, but this feels wasteful. Is there a better way? Let’s have a look at how our processing threads take data out of our ring buffer.
BatchEventProcessor
Typically, an interaction with a ringbuffer might look a bit like this:
1. What's my sequence? n
2. Is item (n+1) ready?
   a.) yes -> process item (n+1), update my sequence to (n+1)
   b.) no -> wait a bit, then go back to the beginning of 2.
In reality however, this is not necessarily the most efficient way to proceed. If we consider the case where entries (n + i) for i in [0, 10] are already ready for processing, we’ll query each of those items for readiness (which must incur some cost, as readiness depends on the action of another thread).
We could instead do something like the following:
1. What's my sequence? n
2. What is the maximum available sequence now? n + i
   a.) If i > 0, process items [n + 1, n + i]
   b.) Otherwise, wait a bit, then go back to the beginning of 2
In the case where there’s only a single writer (a condition we eagerly seek at LMAX Exchange), obtaining the maximum available sequence is just a volatile read, so we’ve gone from i volatile reads, to 1, regardless of the size of i.
Let’s have a look at the actual code that does this in the disruptor library.
final long availableSequence = sequenceBarrier.waitFor(nextSequence);

while (nextSequence <= availableSequence)
{
    event = dataProvider.get(nextSequence);
    eventHandler.onEvent(event, nextSequence, nextSequence == availableSequence);
    nextSequence++;
}

sequence.set(availableSequence);
This looks a bit like the pseudo code. The only major difference is that the ‘waiting a bit’ is hidden within sequenceBarrier.waitFor. This is a deliberately polymorphic piece of code to allow the wait behaviour at that point to be configurable (you can spin, sleep, park, etc).
Does this help us in our enquiries? A little bit.
Batch size as a proxy for wedged/hosedness
Remember: we’re trying to detect issues that have a duration smaller than the polling interval without having to waste resources polling all the time. One extra fact to introduce typically our polling interval is around a second, and in the places we really care about, any wedging/hosing event lasting milliseconds is of interest to us.
In these conditions, we can use i, or batch size, to let us know when something interesting is happening at a fine grained level. Why? Well, how did we get to a point where so many messages were available. Either
a.) The writer thread received a burst of messages from the network or b.) The processing thread spent more time processing than usual
Here, case a is ‘hosed’ and b is ‘wedged’, to a certain degree. In reality, of course, both of these things could be true.
Theoretically, we can now spot smaller hosing and wedging incidents. Recording and monitoring them turns out to be the trickier part.
Batch size tracking
Unfortunately, the nature of batching makes it difficult to discover the size of batches experienced by a processing thread from, uh, anywhere other than the processing thread. In general, that thread has already got a lot of important, money earning work to do, and ideally should not have to perform any monitoring, if possible.
We could push every batch size from that thread to another, via another buffer, but that would penalize a well performing system that’s seeing a large number of very small batches. We could publish batches only over a configured size, but that sounds fiddly. What we’d really like is a histogram of batch sizes across a particular interval.
What we currently have is a single datapoint from that histogram: the maximum batch size. We publish this (roughly) every second. We will avoid diving into why it is ‘rough’ in this post, though.
private long batchSize;

@Override
public void onEvent(final T event, final long sequence, final boolean endOfBatch) throws Exception
{
    eventHandler.onEvent(event, sequence, endOfBatch);
    batchSize++;

    if (endOfBatch)
    {
        batchSizeListener.accept(batchSize);
        batchSize = 0;
    }
}
Here. our batch size listener has the smarts to maintain a maximum, and appropriately communicate with a monitoring thread to achieve our goal of publishing a max batch size per second.
In the latest disruptor, we can avoid having to write this code and simply implement BatchStartAware in any event handler that cares.
What’s left?
When we see a large maximum batch size in a particular interval is that a little wedge event, or a little hose event? Are there any other species of problem that could confound us, too?
Well, at this point, we start to run into issues that are somewhat out of our control. Our networking input threads are reading from circular buffers too, but if they behave in a batched fashion, they don’t make that behaviour clear in the shape of their callback. So, rather than ruling in a burst in input, we’ll perhaps have to rule out a problem in processing.
It’s nanotime, er, time
We’re reaching the point where what we actually want is a lightweight profiler. This is a topic for another post, because we very quickly start having to understand what’s in those ring buffer entries.
To sum up
If you want to avoid polling for depth, look at your writer and reader’s execution patterns to see if there’s anything you could exploit instead. If you’re using disruptor, why not try out BatchSizeAware?