


Special report: ECB decision recap
Today’s report: Supply side constraints
Investors continue to see evidence of inflation being anything but transitory and there is a growing concern about supply side issues within the economy. All of this should be putting more pressure on the Fed to be needing to rethink its policy outlook.
Wake-up call
- hawkish Holzmann
- tax hikes
- emergency extended
- Heavy market
- Ivey PMIs
- RBNZ outlook
- Stocks vulnerable
- Dealers report
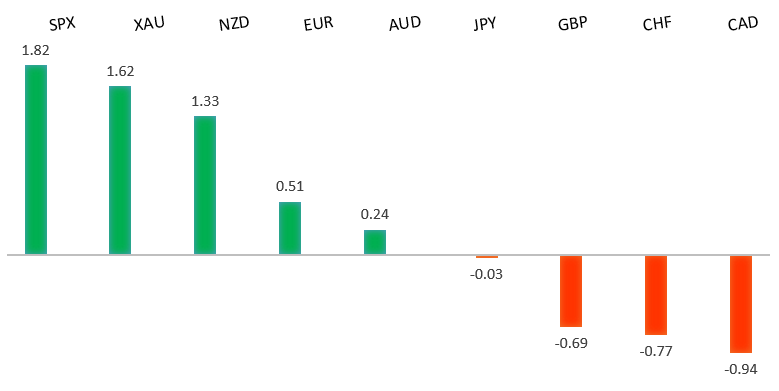
Peformance chart: 30 Day Performance vs. US dollar (%)
Suggested reading
- The Dollar's Rebound May Just Be Getting Started, R. Cookson, Bloomberg (September 8, 2021)
- No, September Isn’t a ‘Bad Month’ for Stocks, Fisher Investments (September 7, 2021)
Chart talk: Technical & fundamental highlights
Choose pair:
EURUSD – technical overview
The market has been looking for a higher low since topping out in 2021 up at 1.2350. Ideally, setbacks continue to be well supported down towards 1.1600 in favour of the next major upside extension back through 1.2350 and towards a retest of the 2018 high at 1.2555 further up. Only a weekly close below 1.1600 would force a rethink.EURUSD – fundamental overview
ECB Holzmann was out saying it was possible to normalize policy sooner than markets expect, though this did nothing to inspire Euro demand, with the single currency mostly under pressure as the US Dollar was broadly bid. Key standouts on today’s calendar come in the form of China inflation, German trade, an RBA Debelle speech, the ECB policy decision, US initial jobless claims, and a batch of Fed speak.EURUSD - Technical charts in detail
GBPUSD – technical overview
The market is in a consolidation phase in the aftermath of the run to fresh 2021 and multi-month highs. At this stage, additional setbacks should be limited to the 1.3500 area ahead of the next major upside extension towards a retest and break of critical resistance in the form of the 2018 high.GBPUSD – fundamental overview
The Pound was under pressure on Wednesday, hit from broad based US Dollar demand and news of proposed tax hikes in the UK. Key standouts on today’s calendar come in the form of China inflation, German trade, an RBA Debelle speech, the ECB policy decision, US initial jobless claims, and a batch of Fed speak.USDJPY – technical overview
The longer-term trend is bearish despite the recent run higher. Look for additional upside to be limited, with scope for a topside failure and bearish resumption back down towards the 100.00 area. It would take a clear break back above 113.00 to negate the outlook.USDJPY – fundamental overview
BOJ Kuroda was on the wires saying policy easing would continue after COVID. Meanwhile, Japan was out extending the state of emergency in 19 regions through the end of the month. Key standouts on today’s calendar come in the form of China inflation, German trade, an RBA Debelle speech, the ECB policy decision, US initial jobless claims, and a batch of Fed speak.AUDUSD – technical overview
The Australian Dollar has been in the process of a healthy correction following the impressive run towards a retest of the 2018 high earlier this year. At this stage, there is risk for additional declines, though setbacks are expected to be well supported down into the 0.7000 area. Look for a weekly close above 0.7500 to force a shift in the structure.AUDUSD – fundamental overview
Aussie was weighed down on Wednesday from the combination of a heavy market for metals, softer US equities and a rallying US Dollar. Key standouts on today’s calendar come in the form of China inflation, German trade, an RBA Debelle speech, the ECB policy decision, US initial jobless claims, and a batch of Fed speak.USDCAD – technical overview
Finally signs of a major bottom in the works after a severe decline from the 2020 high. A recent weekly close back above 1.2500 encourages the constructive outlook and opens the door for a push back towards next critical resistance in the 1.3000 area. Any setbacks should be well supported into the 1.2200s.USDCAD – fundamental overview
The Canadian Dollar was lower on Wednesday in the aftermath of the Bank of Canada decision. The central bank left policy and rates unchanged and failed to upgrade to a more hawkish stance. At the same time, setbacks in the Loonie were somewhat mitigated from the surge in Ivey PMIs. Key standouts on today’s calendar come in the form of China inflation, German trade, an RBA Debelle speech, the ECB policy decision, US initial jobless claims, and a batch of Fed speak.NZDUSD – technical overview
The market has entered a period of consolidation after running up to a yearly and multi-month high. At this stage, rallies should be well capped and there is still room for deeper setbacks into the 0.6500-0.6800 area before we see an attempt at a higher low and resumption of upside pressure. Back above the April high at 0.7317 would be required to force a shift in the structure.NZDUSD – fundamental overview
The New Zealand Dollar has held up on a relative basis despite strong demand for the Buck and softer US equities. It seems the market pricing of a hawkish RBNZ outlook has been the key offsetting variable here. Key standouts on today’s calendar come in the form of China inflation, German trade, an RBA Debelle speech, the ECB policy decision, US initial jobless claims, and a batch of Fed speak.US SPX 500 – technical overview
Longer-term technical studies are looking quite exhausted and the market is showing signs of wanting to roll over after racing to another record high. Look for rallies to be well capped ahead of 4600, with a break back below 4353 to strengthen the outlook.US SPX 500 – fundamental overview
We're trading just off fresh record highs, and yet, with so little room for additional central bank accommodation, given an already depressed interest rate environment, the prospect for sustainable runs to the topside on easy money policy incentives and government stimulus, should no longer be as enticing to investors. Meanwhile, ongoing worry associated with coronavirus fallout and risk of rising inflation should weigh more heavily on investor sentiment into the second half of 2021.GOLD (SPOT) – technical overview
The 2019 breakout above the 2016 high at 1375 was a significant development, opening the door for fresh record highs and an acceleration beyond the next major psychological barrier at 2000. Setbacks should now be well supported above 1600.GOLD (SPOT) – fundamental overview
The yellow metal continues to be well supported on dips with solid demand from medium and longer-term accounts. These players are more concerned about exhausted monetary policy, extended global equities, and coronavirus fallout. All of this should keep the commodity well supported, with many market participants also fleeing to the hard asset as the grand dichotomy of record high equities and record low yields comes to an unnerving climax.