


Special report: ECB decision preview
Today’s report: Trump concerned about strong US Dollar
Most of the attention in recent sessions has been around comments from Donald Trump that the US has a big currency problem, and that the stronger US Dollar is hurting the US when it comes to competition with other trading partners.
Wake-up call
- ECB decision
- Sticky inflation
- Trump comments
- US equities
- oil bounce
- cut odds
- Fed outlook
- Macro themes
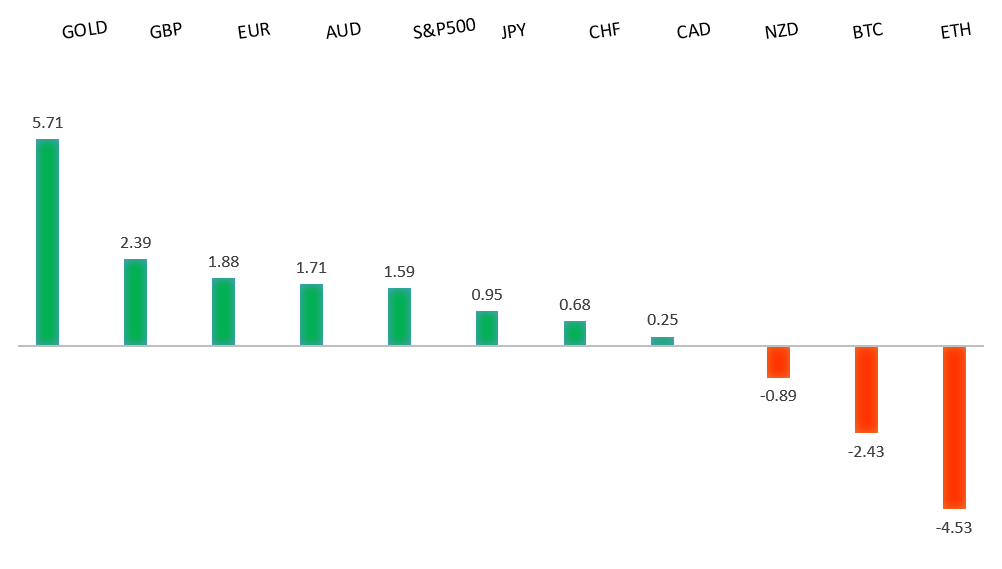
Peformance chart: 30-Day Performance vs. US dollar (%)
Suggested reading
- Who Killed the ESG Party?, D. Garrahan, Financial Times (July 17, 2024)
- The gravity of US stock leadership, T. Nangle, FT Alphaville (July 12, 2024)
Chart talk: Technical & fundamental highlights
Choose pair:
EURUSD – technical overview
The Euro has been in a multi-month consolidation since bottoming out in 2022. Setbacks have since been exceptionally well supported on dips below 1.0500, with a higher platform sought out ahead of the next major upside extension. Look for a push through the 2023 high at 1.1276 to strengthen the constructive outlook and extend the recovery run towards 1.2000. Only back below 1.0400 negates.EURUSD – fundamental overview
The Euro has extended its run, mostly on the back of the latest broad based selling in the US Dollar on the back of Trump's comments about a stronger US Dollar hurting competitiveness. The market will now start positioning into today's ECB decision where no change is expected. Key standouts on Thursday’s calendar come from UK employment, Eurozone construction output, the ECB policy decision, US initial jobless claims, the Philly Fed, and some Fed speak.EURUSD - Technical charts in detail
GBPUSD – technical overview
Signs have emerged of the market wanting to put in a longer-term base after collapsing to a record low in September 2022. The door is now open for the next major upside extension towards the 2023 high at 1.3143. Any setbacks should be well supported ahead of 1.2500.GBPUSD – fundamental overview
The Pound has extended its run of yearly and multi-month highs after UK inflation data came out hotter than expected. Odds for a BOE rate cut in August have now plunged to below 40% from near 70% ten days ago. Key standouts on Thursday’s calendar come from UK employment, Eurozone construction output, the ECB policy decision, US initial jobless claims, the Philly Fed, and some Fed speak.USDJPY – technical overview
The market remains confined to a strong uptrend, most recently extending to a multi-year high through 160.00. Key support comes in at 151.95, with only a weekly close below to delay the constructive outlook. Next major resistance comes in at 165.00.USDJPY – fundamental overview
Donald Trump has been doing a favor (at least for now) for Japanese officials concerned about excessive weakness in the Yen. The latest comments from Trump have him concerned about a stronger Dollar hurting competitiveness. Some Yen shorts have been forced to reconsider bearish bets in the aftermath, especially with Trump leading in the polls. Key standouts on Thursday’s calendar come from UK employment, Eurozone construction output, the ECB policy decision, US initial jobless claims, the Philly Fed, and some Fed speak.AUDUSD – technical overview
There are signs of the potential formation of a longer-term base with the market trading down into a meaningful longer-term support zone. Only a monthly close below 0.6200 would give reason for rethink. Back above 0.6900 will take the big picture pressure off the downside and strengthen case for a bottom.AUDUSD – fundamental overview
Pro-cyclical commodities remain weak and US equities have turned south. All of this has been weighing on the risk correlated Australian Dollar. Key standouts on Thursday’s calendar come from UK employment, Eurozone construction output, the ECB policy decision, US initial jobless claims, the Philly Fed, and some Fed speak.USDCAD – technical overview
Above 1.3000 signals an end to a period of longer-term bearish consolidation and suggests the market is in the process of carving out a more significant longer-term base. Next key resistance now comes in up into the 1.4000 area. Setbacks should be very well supported down into the 1.3000 area.USDCAD – fundamental overview
The Canadian Dollar got some relief from a nice recovery in the price of oil, but couldn't avoid trading lower after Donald Trump put all US trading partners on notice. This weighed on stocks as well, which in turn weighed on the Canadian Dollar. Key standouts on Thursday’s calendar come from UK employment, Eurozone construction output, the ECB policy decision, US initial jobless claims, the Philly Fed, and some Fed speak.NZDUSD – technical overview
Overall pressure remains on the downside with the market continuing to stall out on runs up into the 0.6500 area. At the same time, there are some signs of the market wanting to put in a longer-term base. Ultimately, a break back above 0.6500 would be required to take the medium-term pressure off the downside and encourage this prospect. A monthly close below 0.5800 will intensify bearish price action.NZDUSD – fundamental overview
The New Zealand Dollar has held up exceptionally well in the face of this latest reversal in risk assets. We believe a lot of this could have to do with some sticky components within the latest New Zealand inflation data that have reduced odds for a rate cut in August. Key standouts on Thursday’s calendar come from UK employment, Eurozone construction output, the ECB policy decision, US initial jobless claims, the Philly Fed, and some Fed speak.US SPX 500 – technical overview
Longer-term technical studies continue to look quite extended, begging for a deeper correction ahead. The latest rally has extended to reach and even exceed a 355 point measured move extension target objective in the 5,640 area, adding to the case for an imminent correction. At this stage, additional upside should be limited to allow for overbought studies to unwind. There is now room for a pullback towards previous resistance turned support in the form of the previous record high from April around 5,290.US SPX 500 – fundamental overview
Though we have seen a healthy adjustment of investor expectations towards the amount of rate cuts in 2024, the market still hopes policy will end up erring more towards the investor friendly, accommodative side of things. This bet has kept stocks well bid into dips and consistently pushing record highs. Still, if there is a sense the Fed will need to be more sensitive towards erring on the side of higher rates, it could invite major disruption to the stock market.GOLD (SPOT) – technical overview
The 2019 breakout above the 2016 high at 1375 was a significant development, opening the door for fresh record highs and this next major upside extension into the 2500-3000 area. Setbacks should now be well supported above 2200 on a monthly close basis.GOLD (SPOT) – fundamental overview
The yellow metal has pushed record highs in 2024 with solid demand from medium and longer-term accounts. These players are more concerned about inflation, geopolitical risk and a less upbeat global growth outlook. All of this should keep the commodity well supported, with many market participants also fleeing to the hard asset as the grand dichotomy of record high equities and record low yields comes to an end.