


Next 24 hours: Euro sold on PMIs, bank lending survey
Today’s report: US Dollar relents as worst case scenarios priced out
An overdue round of profit taking on US Dollar longs has kicked in, with market participants making some moves away from the flight to safety play as worst case scenarios are priced out of the conflict in the Middle East.
Wake-up call
- EZ PMIs
- credit outlook
- policy shift
- Aussie PMI
- BoC decision
- risk sentiment
- Geopolitical risk
- Global outlook
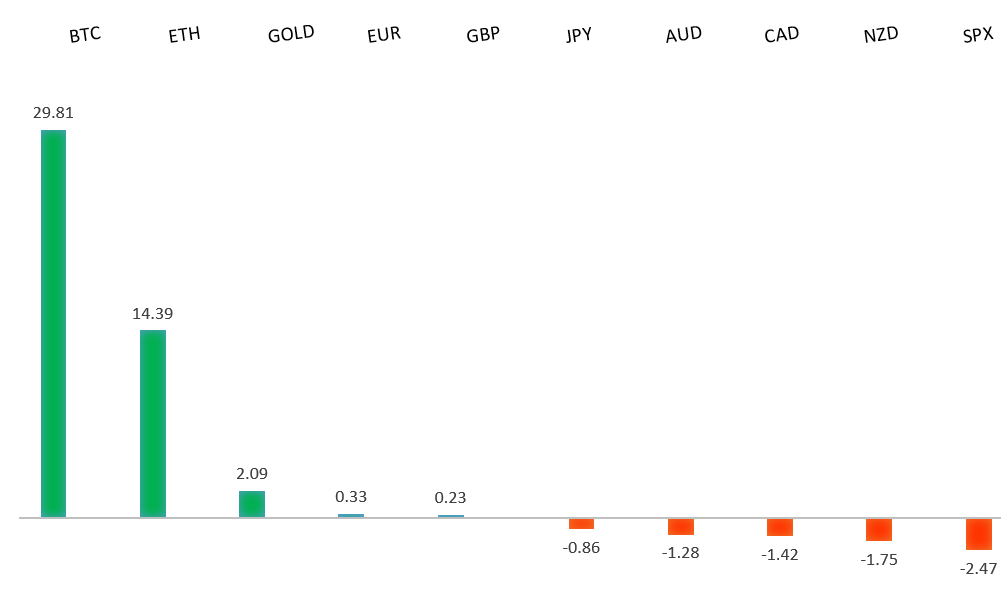
Peformance chart: 30 Day Performance vs. US dollar (%)
Suggested reading
- Bill and Bill’s Big Adventure in Treasuries Land, J. Authers, Bloomberg (October 24, 2023)
- A Better Way to Farm Fish, J. Kerr, Financial Times (October 23, 2023)
Chart talk: Technical & fundamental highlights
Choose pair:
EURUSD – technical overview
Any additional setbacks should be well supported on dips below 1.0500 in favor of the start to the next major upside extension. Ultimately, only a monthly close back below 1.0500 would give reason for concern. Back above 1.0770 will take the immediate pressure off the downside.EURUSD – fundamental overview
Things have calmed down a little in the Middle East, which has resulted in broad based profit taking on Dollar longs. Eurozone consumer confidence declined for a third month. Key standouts on Tuesday’s calendar come from German consumer confidence, UK unemployment, German, Eurozone, and UK PMI reads, UK CBI, an ECB Lagarde speech, and US PMI reads.EURUSD - Technical charts in detail
GBPUSD – technical overview
Signs have emerged of the market wanting to put in a longer-term base after collapsing to a record low in September 2022. The November 2022 monthly close back above 1.2000 strengthens this prospect. Any setbacks should now be well supported ahead of 1.2000. Next key resistance comes in at 1.3143.GBPUSD – fundamental overview
We saw some relative strength in the Pound on Monday after Moody’s removed its negative credit outlook for the UK. Key standouts on Tuesday’s calendar come from German consumer confidence, UK unemployment, German, Eurozone, and UK PMI reads, UK CBI, an ECB Lagarde speech, and US PMI reads.USDJPY – technical overview
At this stage, it looks like the market is wanting to resume the bigger picture uptrend and head back towards a retest of that multi-year high from October 2022 up at 151.95. Look for any weakness to continue to be well supported on dips.USDJPY – fundamental overview
The Yen has steadied near recent lows on speculation over a possible BOJ policy shift next week. Key standouts on Tuesday’s calendar come from German consumer confidence, UK unemployment, German, Eurozone, and UK PMI reads, UK CBI, an ECB Lagarde speech, and US PMI reads.AUDUSD – technical overview
There are signs of the potential formation of a longer-term base with the market trading down into a meaningful longer-term support zone. Only a monthly close below 0.6300 would give reason for rethink. Back above 0.6523 will take the immediate pressure off the downside and strengthen case for a bottom.AUDUSD – fundamental overview
The Australian Dollar is higher into Tuesday on account of broad based flow supporting a lower US Dollar and higher stocks. However, a round of softer PMI data out of Australia has limited the extent of gains. Key standouts on Tuesday’s calendar come from German consumer confidence, UK unemployment, German, Eurozone, and UK PMI reads, UK CBI, an ECB Lagarde speech, and US PMI reads.USDCAD – technical overview
Above 1.3000 signals an end to a period of longer-term bearish consolidation and suggests the market is in the process of carving out a more significant longer-term base. Next key resistance now comes in up into the 1.4000 area. Setbacks should be very well supported down into the 1.3000 area.USDCAD – fundamental overview
The Canadian Dollar has seen a mild recovery on broad based profit taking of US Dollar longs. Still, movement has been contained on account of positioning into tomorrow's Bank of Canada decision. Key standouts on Tuesday’s calendar come from German consumer confidence, UK unemployment, German, Eurozone, and UK PMI reads, UK CBI, an ECB Lagarde speech, and US PMI reads.NZDUSD – technical overview
Overall pressure remains on the downside with the market once again stalling out on a run up into the 0.6500 area. Ultimately, a break back above 0.6049 would be required to take the immediate pressure off the downside. A monthly close below 0.5800 would intensify bearish price action.NZDUSD – fundamental overview
Finally, some relief for the New Zealand Dollar which has recovered out from yearly lows on the back of broad based risk on flow and profit taking on US Dollar longs. Key standouts on Tuesday’s calendar come from German consumer confidence, UK unemployment, German, Eurozone, and UK PMI reads, UK CBI, an ECB Lagarde speech, and US PMI reads.US SPX 500 – technical overview
Longer-term technical studies are in the process of unwinding from extended readings off record highs. Look for rallies to be well capped in favor of lower tops and lower lows. A monthly close back above 4600 will be required to take the immediate pressure off the downside. Next key support comes in at 4200.US SPX 500 – fundamental overview
Investors continue to struggle with the reality of a higher for longer Fed policy track in the face of ongoing worry around inflation, while also contending with an escalation in geopolitical risk. Overall, we expect inflation to continue to be a problem in 2023 that results in downside pressure into rallies despite market expectations that would argue otherwise.GOLD (SPOT) – technical overview
The 2019 breakout above the 2016 high at 1375 was a significant development, opening the door for fresh record highs. Setbacks should now be well supported above 1600 on a monthly close basis ahead of the next major upside extension. Next major resistance comes in at 2100, above which opens the next extension towards 2500.GOLD (SPOT) – fundamental overview
The yellow metal continues to be well supported on dips with solid demand from medium and longer-term accounts. These players are more concerned about inflation risk and a less stable and upbeat global growth outlook. All of this should keep the commodity well supported, with many market participants also fleeing to the hard asset as the grand dichotomy of record high equities and record low yields comes to an unnerving climax.