


Special report: US CPI Preview
Today’s report: US inflation data in focus
Monday was a day of consolidation for the most part, this after the risk liquidation into the end of last week, and perhaps also ahead of today’s key event risk in the form of US inflation data.
Wake-up call
- energy costs
- BOE hawkishness
- more stimulus
- RBA Lowe
- Economists downgrade
- COVID updates
- Stocks vulnerable
- Dealers report
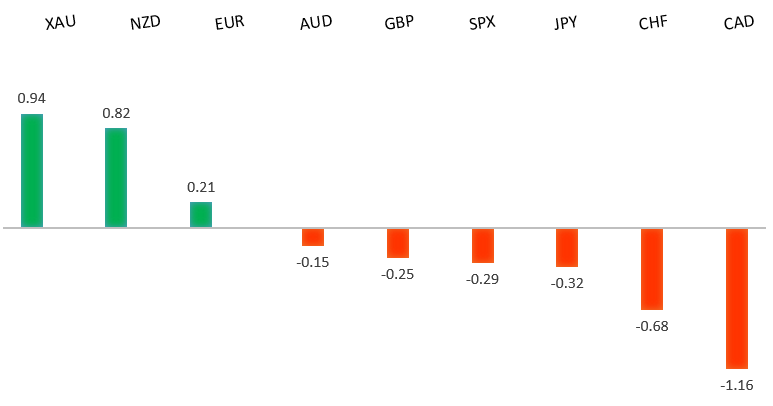
Peformance chart: 30 Day Performance vs. US dollar (%)
Suggested reading
- ‘Lie Flat’ If You Want, But Be Ready to Pay the Price, A. Schrager, Bloomberg (September 12, 2021)
- China Tries to Enter Into Global Semiconductor Ranks, R. Kargaard, Forbes (September 10, 2021)
Chart talk: Technical & fundamental highlights
Choose pair:
EURUSD – technical overview
The market has been looking for a higher low since topping out in 2021 up at 1.2350. Ideally, setbacks continue to be well supported down towards 1.1600 in favour of the next major upside extension back through 1.2350 and towards a retest of the 2018 high at 1.2555 further up. Only a weekly close below 1.1600 would force a rethink.EURUSD – fundamental overview
German gas prices hit an all time high and the spike in energy costs has been weighing on the Euro outlook. Key standouts on today’s calendar come in the form of UK jobs, and US inflation reads.EURUSD - Technical charts in detail
GBPUSD – technical overview
The market is in a consolidation phase in the aftermath of the run to fresh 2021 and multi-month highs. At this stage, additional setbacks should be limited to the 1.3500 area ahead of the next major upside extension towards a retest and break of critical resistance in the form of the 2018 high.GBPUSD – fundamental overview
The Pound has been well supported on more hawkish BOE expectations. The market is also anticipating new chief economist Pill to add to the hawkish communications. Key standouts on today’s calendar come in the form of UK jobs, and US inflation reads.USDJPY – technical overview
The longer-term trend is bearish despite the recent run higher. Look for additional upside to be limited, with scope for a topside failure and bearish resumption back down towards the 100.00 area. It would take a clear break back above 113.00 to negate the outlook.USDJPY – fundamental overview
We've seen expectations of additional stimulus in Japan, and we've also seen a massive run higher in the Nikkei. And yet, the Yen hasn't sold off all much, suggesting risk markets may not be as strong as price action is suggesting. Key standouts on today’s calendar come in the form of UK jobs, and US inflation reads.AUDUSD – technical overview
The Australian Dollar has been in the process of a healthy correction following the impressive run towards a retest of the 2018 high earlier this year. At this stage, there is risk for additional declines, though setbacks are expected to be well supported down into the 0.7000 area. Look for a weekly close above 0.7500 to force a shift in the structure.AUDUSD – fundamental overview
Earlier today, RBA Governor Lowe pushed back against the market pricing of higher monetary policy rates in 2022 and 2023. This has had a weighing influence on the Australian Dollar. Key standouts on today’s calendar come in the form of UK jobs, and US inflation reads.USDCAD – technical overview
Finally signs of a major bottom in the works after a severe decline from the 2020 high. A recent weekly close back above 1.2500 encourages the constructive outlook and opens the door for a push back towards next critical resistance in the 1.3000 area. Any setbacks should be well supported into the 1.2200s.USDCAD – fundamental overview
A recent economist survey has downgraded Canada growth. Q3 growth is now seen at 4% from 7.8% previous, while Q4 growth is projected to come in at 5.8% from 6% previous. Key standouts on today’s calendar come in the form of UK jobs, and US inflation reads.NZDUSD – technical overview
The market has entered a period of consolidation after running up to a yearly and multi-month high. At this stage, rallies should be well capped and there is still room for deeper setbacks into the 0.6500-0.6800 area before we see an attempt at a higher low and resumption of upside pressure. Back above the April high at 0.7317 would be required to force a shift in the structure.NZDUSD – fundamental overview
The New Zealand Dollar is doing its best to hold up, getting some help from the Monday recovery in US equities. At the same time, there has been some selling around the news that the New Zealand lockdown has been extended out to September 21st. Key standouts on today’s calendar come in the form of UK jobs, and US inflation reads.US SPX 500 – technical overview
Longer-term technical studies are looking quite exhausted and the market is showing signs of wanting to roll over after racing to another record high. Look for rallies to be well capped ahead of 4600, with a break back below 4353 to strengthen the outlook.US SPX 500 – fundamental overview
We're trading just off fresh record highs, and yet, with so little room for additional central bank accommodation, given an already depressed interest rate environment, the prospect for sustainable runs to the topside on easy money policy incentives and government stimulus, should no longer be as enticing to investors. Meanwhile, ongoing worry associated with coronavirus fallout and risk of rising inflation should weigh more heavily on investor sentiment into the second half of 2021.GOLD (SPOT) – technical overview
The 2019 breakout above the 2016 high at 1375 was a significant development, opening the door for fresh record highs and an acceleration beyond the next major psychological barrier at 2000. Setbacks should now be well supported above 1600.GOLD (SPOT) – fundamental overview
The yellow metal continues to be well supported on dips with solid demand from medium and longer-term accounts. These players are more concerned about exhausted monetary policy, extended global equities, and coronavirus fallout. All of this should keep the commodity well supported, with many market participants also fleeing to the hard asset as the grand dichotomy of record high equities and record low yields comes to an unnerving climax.