


Today’s report: Where we're at into the weekly close
It seems the Fed has fewer and fewer excuses to avoid tapering and as much as investors don’t want this to be the case, this harsh reality is starting to have an impact on price action. Stocks have been struggling to rally and the US Dollar is finding more and more bids.
Wake-up call
- ECB report
- US banks
- economic assessment
- Weak jobs
- commodities
- hike odds
- Stocks vulnerable
- Dealers report
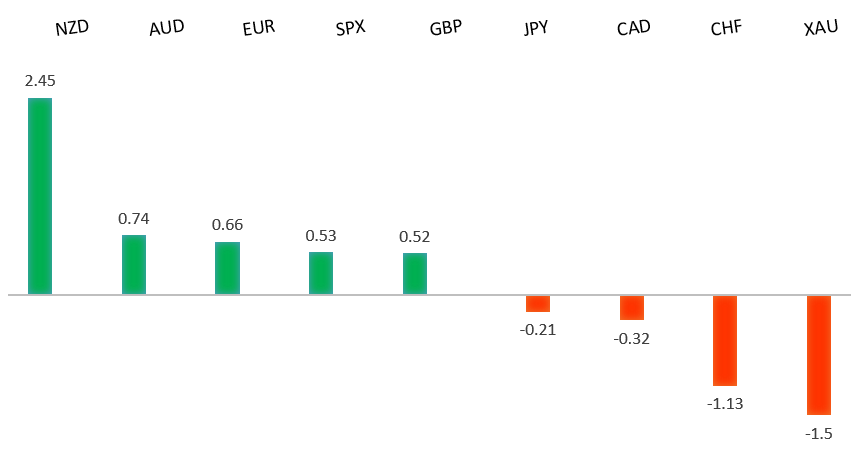
Peformance chart: 30 Day Performance vs. US dollar (%)
Suggested reading
- If Your CEO Talks Like Kant, Think Twice Before Investing, J. Authers, Bloomberg (September 17, 2021)
- This Tesla co-founder has a plan to recycle your EV batteries, P. McGee, AIER (September 15, 2021)
Chart talk: Technical & fundamental highlights
Choose pair:
EURUSD – technical overview
The market has been looking for a higher low since topping out in 2021 up at 1.2350. Ideally, setbacks continue to be well supported down towards 1.1600 in favour of the next major upside extension back through 1.2350 and towards a retest of the 2018 high at 1.2555 further up. Only a weekly close below 1.1600 would force a rethink.EURUSD – fundamental overview
Soaring energy costs in Europe are threatening the zone with stagflation risk and this seems to be weighing on the single currency this week. There wasn't much support at all from the news of an unpublished ECB report that rates could rise in 2025. Key standouts on today’s calendar come in the form of UK retail sales, the Eurozone current account, Eurozone inflation, and US Michigan sentiment.EURUSD - Technical charts in detail
GBPUSD – technical overview
The market is in a consolidation phase in the aftermath of the run to fresh 2021 and multi-month highs. At this stage, additional setbacks should be limited to the 1.3500 area ahead of the next major upside extension towards a retest and break of critical resistance in the form of the 2018 high.GBPUSD – fundamental overview
Traders have been betting on a more hawkish BOE and this has been behind some of the recent demand we've been seeing in the Pound. Bank of America is looking for a February rate hike and Goldman is calling for the base rate at 1% by the end of 2023. Key standouts on today’s calendar come in the form of UK retail sales, the Eurozone current account, Eurozone inflation, and US Michigan sentiment.USDJPY – technical overview
The longer-term trend is bearish despite the recent run higher. Look for additional upside to be limited, with scope for a topside failure and bearish resumption back down towards the 100.00 area. It would take a clear break back above 113.00 to negate the outlook.USDJPY – fundamental overview
The Japanese government has just cut its economic assessment for the first time in four months, saying the pace of recovery has weakened. This has opened some selling of the Yen, though there continues to be demand for the Yen on dips from safe haven buyers. Key standouts on today’s calendar come in the form of UK retail sales, the Eurozone current account, Eurozone inflation, and US Michigan sentiment.AUDUSD – technical overview
The Australian Dollar has been in the process of a healthy correction following the impressive run towards a retest of the 2018 high earlier this year. At this stage, there is risk for additional declines, though setbacks are expected to be well supported down into the 0.7000 area. Look for a weekly close above 0.7500 to force a shift in the structure.AUDUSD – fundamental overview
The Australian Dollar has been under pressure in the aftermath of this week's poor Aussie jobs data. Meanwhile, another weight on the Australian Dollar has been the large selloff in the price of iron ore this month. Key standouts on today’s calendar come in the form of UK retail sales, the Eurozone current account, Eurozone inflation, and US Michigan sentiment.USDCAD – technical overview
Finally signs of a major bottom in the works after a severe decline from the 2020 high. A recent weekly close back above 1.2500 encourages the constructive outlook and opens the door for a push back towards next critical resistance in the 1.3000 area. Any setbacks should be well supported into the 1.2200s.USDCAD – fundamental overview
The Canadian Dollar has been tracking lower with commodities, and has also seen some adding selling on this latest batch of softer economic data in the form of wholesale trade sales and housing starts. Key standouts on today’s calendar come in the form of UK retail sales, the Eurozone current account, Eurozone inflation, and US Michigan sentiment.NZDUSD – technical overview
The market has entered a period of consolidation after running up to a yearly and multi-month high. At this stage, rallies should be well capped and there is still room for deeper setbacks into the 0.6500-0.6800 area before we see an attempt at a higher low and resumption of upside pressure. Back above the April high at 0.7317 would be required to force a shift in the structure.NZDUSD – fundamental overview
The New Zealand Dollar is coming off a weaker Thursday session but has managed to outperform overall on the back of solid data and hawkish RBNZ expectations. New Zealand Q2 GDP came in much better than expected this week and odds for a 50bp RBNZ hike next month have jumped to 44% from just 16%. Key standouts on today’s calendar come in the form of UK retail sales, the Eurozone current account, Eurozone inflation, and US Michigan sentiment.US SPX 500 – technical overview
Longer-term technical studies are looking quite exhausted and the market is showing signs of wanting to roll over after racing to another record high. Look for rallies to be well capped ahead of 4600, with a break back below 4353 to strengthen the outlook.US SPX 500 – fundamental overview
We're trading just off fresh record highs, and yet, with so little room for additional central bank accommodation, given an already depressed interest rate environment, the prospect for sustainable runs to the topside on easy money policy incentives and government stimulus, should no longer be as enticing to investors. Meanwhile, ongoing worry associated with coronavirus fallout and risk of rising inflation should weigh more heavily on investor sentiment into the second half of 2021.GOLD (SPOT) – technical overview
The 2019 breakout above the 2016 high at 1375 was a significant development, opening the door for fresh record highs and an acceleration beyond the next major psychological barrier at 2000. Setbacks should now be well supported above 1600.GOLD (SPOT) – fundamental overview
The yellow metal continues to be well supported on dips with solid demand from medium and longer-term accounts. These players are more concerned about exhausted monetary policy, extended global equities, and coronavirus fallout. All of this should keep the commodity well supported, with many market participants also fleeing to the hard asset as the grand dichotomy of record high equities and record low yields comes to an unnerving climax. [audio mp3="https://www.lmax.com/blog/wp-content/uploads/sites/4/2021/09/15seplmaxaudio.mp3"][/audio]