


Special report: ECB decision preview
Today’s report: Why the market is feeling better today
There was an initial reaction of Dollar demand and downside pressure on US equities in the aftermath of the US CPI release, before the market was able to take it all in and get back to feeling good about more Fed rate cuts than less in 2024.
Wake-up call
- dovish ECB
- BOE easing
- producer prices
- shrugs off
- oil bounce
- sentiment uptick
- accommodative policy
- Macro themes
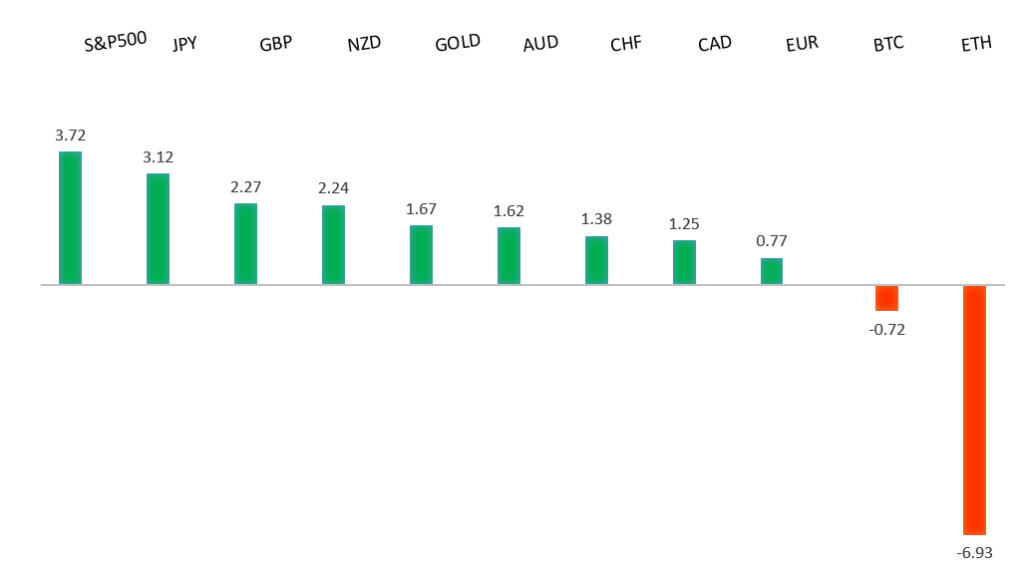
Peformance chart: 30-Day Performance vs. US dollar (%)
Suggested reading
- Should Investors Ignore Past Stock Market Returns?, J. Rekenthaler, Morningstar (September 11, 2024)
- What the Yen Carry Trade Unwind Could Mean For Markets, B. Khurana, Wellington (September 11, 2024)
Chart talk: Technical & fundamental highlights
Choose pair:
EURUSD – technical overview
The Euro has been in a multi-month consolidation since bottoming out in 2022. Setbacks have since been exceptionally well supported on dips below 1.0500, with a higher platform sought out ahead of the next major upside extension. Look for a push through the 2023 high at 1.1276 to strengthen the constructive outlook and extend the recovery run towards 1.2000. Only back below 1.0400 negates.EURUSD – fundamental overview
The Euro has come under some pressure this week on the back of softer economic data reads and an expectation for a dovish policy decision from the ECB later today. Key standouts on Thursday’s calendar come from German wholesale prices, some ECB and BOE speak, the ECB policy decision, Canada building permits, US initial jobless claims, and US producer prices.EURUSD - Technical charts in detail
GBPUSD – technical overview
Signs have emerged of the market wanting to put in a longer-term base after collapsing to a record low in September 2022. The door is now open for the next major upside extension towards the 2018 high at 1.4377. Any setbacks should be well supported ahead of 1.2500.GBPUSD – fundamental overview
The Pound is coming out of a Wednesday session in which it struggled with softer UK GDP and industrial production reads. The local rate market is now pricing 51 basis points of BOE easing by year end as compared to 40 basis points at the start of the month. Key standouts on Thursday’s calendar come from German wholesale prices, some ECB and BOE speak, the ECB policy decision, Canada building permits, US initial jobless claims, and US producer prices.USDJPY – technical overview
The market has entered a period of correction after extending the uptrend to a multi-year high through 160.00. Critical support comes in around 140.00, with only a monthly close below the barrier to compromise the bullish outlook. A higher low is ideally sought out above 140.00 in favor of a bullish continuation.USDJPY – fundamental overview
The Yen is finally finding more substantive offers after pushing to a fresh yearly high. It seems this latest round of softer Japan producer prices is reducing investor bets for another BOJ rate hike in Q4. Key standouts on Thursday’s calendar come from German wholesale prices, some ECB and BOE speak, the ECB policy decision, Canada building permits, US initial jobless claims, and US producer prices.AUDUSD – technical overview
There are signs of the potential formation of a longer-term base with the market trading down into a meaningful longer-term support zone. Only a monthly close below 0.6200 would give reason for rethink. Back above 0.6900 will take the big picture pressure off the downside and strengthen case for a bottom.AUDUSD – fundamental overview
The Australian Dollar is doing a good job shrugging off this latest round of cooler Aussie consumer inflation expectations. The currency has been more focused on broad Dollar selling and demand for US equities in the aftermath of the softer US inflation data. Key standouts on Thursday’s calendar come from German wholesale prices, some ECB and BOE speak, the ECB policy decision, Canada building permits, US initial jobless claims, and US producer prices.USDCAD – technical overview
A sustained hold above 1.3000 over the past several months signals an end to a period of longer-term bearish consolidation and suggests the market is in the process of carving out a more significant longer-term base. Next key resistance now comes in up into the 1.4000 area, with a break to open a retest of the 2020 high just ahead of 1.4700. Setbacks should be very well supported down into the 1.3000 area.USDCAD – fundamental overview
Most of this latest run of Canadian Dollar demand is coming from a rebound in the price of oil and some broad based US Dollar selling post softer US CPI. Key standouts on Thursday’s calendar come from German wholesale prices, some ECB and BOE speak, the ECB policy decision, Canada building permits, US initial jobless claims, and US producer prices.NZDUSD – technical overview
Overall pressure remains on the downside with the market continuing to stall out on runs up into the 0.6500 area. At the same time, there are some signs of the market wanting to put in a longer-term base. Ultimately, a break back above 0.6500 would be required to take the medium-term pressure off the downside and encourage this prospect. A monthly close below 0.5800 will intensify bearish price action.NZDUSD – fundamental overview
The New Zealand Dollar has been better bid on Thursday, finding momentum on the back of renewed US Dollar selling and equities demand post the softer US CPI reading. Key standouts on Thursday’s calendar come from German wholesale prices, some ECB and BOE speak, the ECB policy decision, Canada building permits, US initial jobless claims, and US producer prices.US SPX 500 – technical overview
The longer term uptrend remains intact and dips continue to be exceptionally well supported. Critical support comes in at 5093, with only a break back below this level to compromise the structure and open the door for a more significant corrective decline. Until then, the focus remains on a retest and break back above the record high.US SPX 500 – fundamental overview
The US equities market remains exceptionally well supported in 2024 on the back of an ongoing expectation for more rate cuts than less going forward. Investors are feeling better about a soft landing in the US economy and this has also been accompanied by an accommodative adjustment of Fed policy. It will however be important to keep an eye on inflation, bigger picture economic data and geopolitical risk in the months ahead.GOLD (SPOT) – technical overview
The 2019 breakout above the 2016 high at 1375 was a significant development, opening the door for fresh record highs and this next major upside extension into the 2500-3000 area. Setbacks should now be well supported above 2300 on a monthly close basis.GOLD (SPOT) – fundamental overview
The yellow metal has pushed record highs in 2024 with solid demand from medium and longer-term accounts. These players are more concerned about inflation, geopolitical risk and a less upbeat global growth outlook. All of this should keep the commodity well supported over the coming months.