


Today’s report: Yen sinks to lowest level since January 2017
The US Dollar comes into Friday looking a little more bid overall, this after US inflation data produced a print at a plus 40 year high. The data points to a US Dollar that should continue to be in demand as the Fed is forced to adjust rates higher in response to surging inflation.
Wake-up call
- Euro holds
- calendar stacked
- Yield differentials
- RBA expectations
- Oil
- stocks, commodities
- Stocks vulnerable
- Dealers report
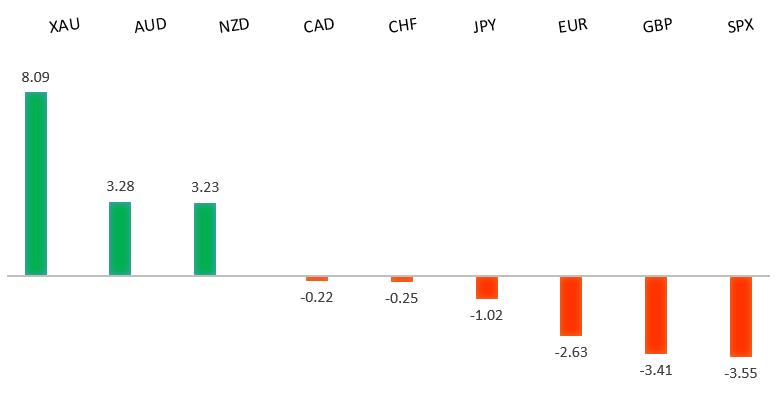
Peformance chart: 30 Day Performance vs. US dollar (%)
Suggested reading
- What Will Be the Inflation Hit to Come From Ukraine?, J. Authers, Bloomberg (March 11, 2022)
- Evergrande: A Turning Point for China, D. Garrahan, Financial Times (March 10, 2022)
Chart talk: Technical & fundamental highlights
Choose pair:
EURUSD – technical overview
The latest breakdown below 1.1100 to fresh multi-month lows now sets up the next major downside extension below 1.1000 towards the multi-year low from 2020 in the 1.0600 area. At this stage, it will take a push back above 1.1500 to force a shift in the outlook.EURUSD – fundamental overview
The ECB held rates as expected but removed wording relating to the OCR being potentially lower than current levels and announced a quicker end to asset purchases. The ECB now sees 2022 GDP at 3.7% vs 4.2% previously and 2022 inflation at 5.1% vs 3.2% prior. Money market ECB 25bps rate hike expectations were moved forward to September. Key standouts on today’s calendar come in the form of German inflation, UK industrial production, construction output, and GDP, Canada employment, and Michigan sentiment.EURUSD - Technical charts in detail
GBPUSD – technical overview
The market is in a correction phase in the aftermath of the run to fresh multi-month highs in 2021. At this stage, additional setbacks should be limited to the 1.3000 area ahead of the next major upside extension towards a retest and break of critical resistance in the form of the 2018 high. Back above 1.3835 takes pressure off the downside.GBPUSD – fundamental overview
There hasn't been much in the way of fundamental updates out of the UK this week, though we do get a lot of UK data on this Friday. For the most part, GBP weakness has come from broad based US Dollar demand. Key standouts on today’s calendar come in the form of German inflation, UK industrial production, construction output, and GDP, Canada employment, and Michigan sentiment.USDJPY – technical overview
The longer-term trend is bearish despite the recent run higher. Look for additional upside to be limited, with scope for a topside failure and bearish resumption back down towards the 100.00 area. It would take a clear break back above 117.00 to negate the outlook.USDJPY – fundamental overview
We've seen a clear wave of Yen selling this week, with the currency dropping to its lowest levels against the US Dollar since January 2017. Yield differentials have been the primary driver here, with risk off flow that would normally factor into Yen strength, not enough to offset to this point. Key standouts on today’s calendar come in the form of German inflation, UK industrial production, construction output, and GDP, Canada employment, and Michigan sentiment.AUDUSD – technical overview
At this stage, the market has found a bottom and is trying to work back to the topside. Ultimately, it will take a break back above 0.7600 to shift the focus back on the topside. A weekly close below 0.7000 will force a bearish shift.AUDUSD – fundamental overview
Economists now see the RBA raising rates twice this year, in August and September, versus only November previously, due to spiking inflation. Key standouts on today’s calendar come in the form of German inflation, UK industrial production, construction output, and GDP, Canada employment, and Michigan sentiment.USDCAD – technical overview
Finally signs of a major bottom in the works after a severe decline from the 2020 high. A recent weekly close back above 1.2500 encourages the constructive outlook and opens the door for a push back towards next critical resistance in the 1.3000 area. Any setbacks should be well supported into the 1.2200s.USDCAD – fundamental overview
The Canadian Dollar is coming off another session of gains as oil attempts to stabilize above $100. Economists now see the Canadian economy growing 2.8% QoQ in Q1 versus 0.9% previously. Key standouts on today’s calendar come in the form of German inflation, UK industrial production, construction output, and GDP, Canada employment, and Michigan sentiment.NZDUSD – technical overview
Setbacks have intensified in recent weeks with the market trading down to fresh multi-month lows. A recent breakdown below the 0.6700 area opens the door for a drop towards 0.6500 in the sessions ahead.NZDUSD – fundamental overview
A resurgence in global risk appetite and ongoing support for commodities prices have kept the New Zealand Dollar well in demand this week. On the data front, New Zealand February credit card spending fell for the first time in 6 months at -7.6% MoM versus a revised lower +1.9% in January. Key standouts on today’s calendar come in the form of German inflation, UK industrial production, construction output, and GDP, Canada employment, and Michigan sentiment.US SPX 500 – technical overview
Longer-term technical studies are in the process of unwinding from extended readings off record highs. The latest breakdown below 4,272 opens the door for the next major downside extension towards 3,500. Back above 4,612 will be required at a minimum to take the immediate pressure off the downside.US SPX 500 – fundamental overview
With so little room for additional central bank accommodation, given an already depressed interest rate environment, the prospect for sustainable runs to the topside on easy money policy incentives and government stimulus, should no longer be as enticing to investors. Meanwhile, ongoing worry associated with coronavirus fallout, rising inflation, and geopolitical tension should weigh more heavily on investor sentiment in Q1 2022.GOLD (SPOT) – technical overview
The 2019 breakout above the 2016 high at 1375 was a significant development, opening the door for fresh record highs. Setbacks should now be well supported above 1900.GOLD (SPOT) – fundamental overview
The yellow metal continues to be well supported on dips with solid demand from medium and longer-term accounts. These players are more concerned about exhausted monetary policy, extended global equities, coronavirus fallout, inflation risk, and geopolitical tension. All of this should keep the commodity well supported, with many market participants also fleeing to the hard asset as the grand dichotomy of record high equities and record low yields comes to an unnerving climax.