


Next 24 hours: Yen keeps on falling
Today’s report: Dollar demand is a thing in 2022
We left off with things in deterioration mode into the end of last week and this is where we’re picking back up as the new week gets going. All of the positive headlines around Russia and the Ukraine have faded away, while concerns around the outlook in China are working their way into the picture.
Wake-up call
- Euro exposed
- Russian sanctions
- Yield differentials
- AUDUSD China outlook in deterioration
- Oil retreat
- Unstable outlook
- Stocks vulnerable
- Dealers report
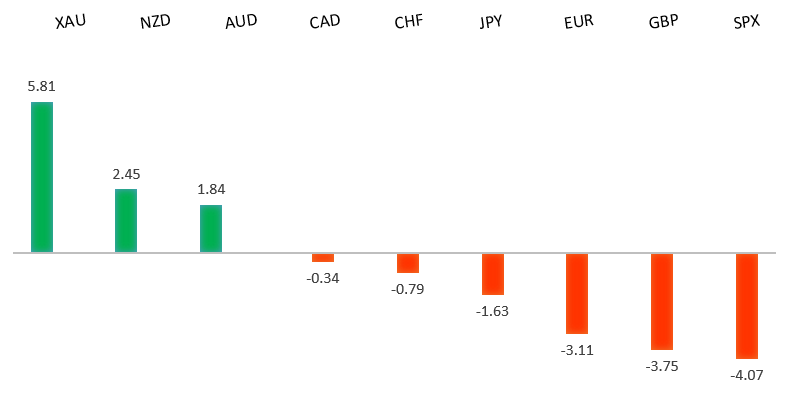
Peformance chart: 30 Day Performance vs. US dollar (%)
Suggested reading
- The West Needs an Off-Ramp From Sanctions, Too, J. Authers, Bloomberg (March 14, 2022)
- Evergrande: A Turning Point for China, D. Garrahan, Financial Times (March 10, 2022)
Chart talk: Technical & fundamental highlights
Choose pair:
EURUSD – technical overview
The latest breakdown below 1.1100 to fresh multi-month lows now sets up the next major downside extension below 1.1000 towards the multi-year low from 2020 in the 1.0600 area. At this stage, it will take a push back above 1.1500 to force a shift in the outlook.EURUSD – fundamental overview
All of the positive Ukraine news flow has dried up and this has put the focus back on the negative headlines, which has weighed on the Euro. The single currency continues to be exposed to downside risk associated with the war. Looking ahead, Monday’s calendar is exceptionally thin, with only US consumer inflation expectations standing out.EURUSD - Technical charts in detail
GBPUSD – technical overview
The market is in a correction phase in the aftermath of the run to fresh multi-month highs in 2021. At this stage, additional setbacks should be limited to the 1.3000 area ahead of the next major upside extension towards a retest and break of critical resistance in the form of the 2018 high. Back above 1.3835 takes pressure off the downside.GBPUSD – fundamental overview
The UK economy is facing a lot of pressure from the commodities surge, while the myriad of Russian sanctions serves as an overhang on the UK financial sector. Recent better than expected UK data has not factored into price action, with the Pound weighed down on the larger risk. Looking ahead, Monday’s calendar is exceptionally thin, with only US consumer inflation expectations standing out.USDJPY – technical overview
The longer-term trend is bearish despite the recent run higher. Look for additional upside to be limited, with scope for a topside failure and bearish resumption back down towards the 100.00 area. It would take a clear break back above 120.00 to negate the outlook.USDJPY – fundamental overview
The Yen continues to get hammered to multi-month lows, with the worsening terms of trade and widening yield differentials with the US Dollar playing a major part. Moreover, the fact that stocks haven’t been hit has hard, is taking away from any Yen demand we might normally see in a risk off backdrop, further intensifying the Yen outflows. Looking ahead, Monday’s calendar is exceptionally thin, with only US consumer inflation expectations standing out.AUDUSD – technical overview
At this stage, the market has found a bottom and is trying to work back to the topside. Ultimately, it will take a break back above 0.7600 to shift the focus back on the topside. A weekly close below 0.7000 will force a bearish shift.AUDUSD – fundamental overview
The outlook in China is deteriorating, while overall global sentiment is on the decline. All of this happening at a time when commodities prices are finally correcting from big runs higher. And so clearly we’re seeing downside pressure on the Australian Dollar as a consequence. Looking ahead, Monday’s calendar is exceptionally thin, with only US consumer inflation expectations standing out.USDCAD – technical overview
Finally signs of a major bottom in the works after a severe decline from the 2020 high. A recent weekly close back above 1.2500 encourages the constructive outlook and opens the door for a push back towards next critical resistance in the 1.3000 area. Any setbacks should be well supported into the 1.2200s.USDCAD – fundamental overview
The Canadian Dollar tried hard to rally on the strong Canada jobs beat, but ultimately, fell victim to bigger picture flow. The ongoing deterioration in global sentiment, geopolitical tension and pullback in the price of oil have been too much to ignore. Looking ahead, Monday’s calendar is exceptionally thin, with only US consumer inflation expectations standing out.NZDUSD – technical overview
Setbacks have intensified in recent weeks with the market trading down to fresh multi-month lows. A recent breakdown below the 0.6700 area opens the door for a drop towards 0.6500 in the sessions ahead.NZDUSD – fundamental overview
The outlook in China is deteriorating, while overall global sentiment is on the decline. All of this happening at a time when commodities prices are finally correcting from big runs higher. And so clearly we’re seeing downside pressure on the New Zealand Dollar as a consequence. Looking ahead, Monday’s calendar is exceptionally thin, with only US consumer inflation expectations standing out.US SPX 500 – technical overview
Longer-term technical studies are in the process of unwinding from extended readings off record highs. The latest breakdown below 4,272 opens the door for the next major downside extension towards 3,500. Back above 4,612 will be required at a minimum to take the immediate pressure off the downside.US SPX 500 – fundamental overview
With so little room for additional central bank accommodation, given an already depressed interest rate environment, the prospect for sustainable runs to the topside on easy money policy incentives and government stimulus, should no longer be as enticing to investors. Meanwhile, ongoing worry associated with coronavirus fallout, rising inflation, and geopolitical tension should weigh more heavily on investor sentiment in Q1 2022.GOLD (SPOT) – technical overview
The 2019 breakout above the 2016 high at 1375 was a significant development, opening the door for fresh record highs. Setbacks should now be well supported above 1900.GOLD (SPOT) – fundamental overview
The yellow metal continues to be well supported on dips with solid demand from medium and longer-term accounts. These players are more concerned about exhausted monetary policy, extended global equities, coronavirus fallout, inflation risk, and geopolitical tension. All of this should keep the commodity well supported, with many market participants also fleeing to the hard asset as the grand dichotomy of record high equities and record low yields comes to an unnerving climax.