


Next 24 hours: The $2 trillion question
Today’s report: $2 trillion in US stimulus?
The big news into Thursday is the news that President-elect Biden will propose an even bigger plan than analysts were expecting, to the tune of USD $2 trillion. Interestingly enough, the market hasn’t really done much with the news and we continue to be in this unsettling consolidation phase.
Wake-up call
- political instability
- Quiet calendar
- Economic conditions
- SNB policy
- China imports
- Oil strength
- multi-tranche offering
- Stocks vulnerable
- Dealers report
- Bigger money
- defi bubble
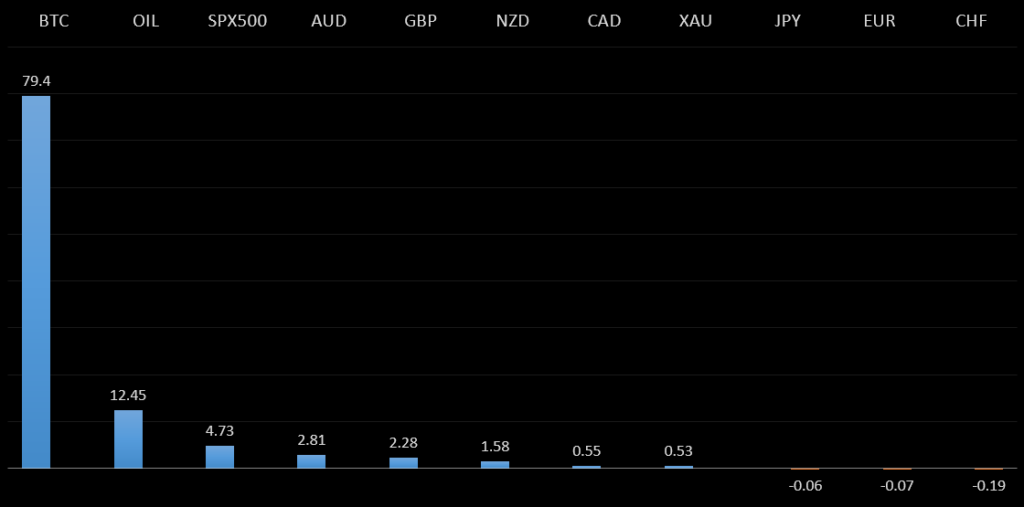
Peformance chart: 30 Day Performance vs. US dollar (%)
Suggested reading
- China Hitting the Accelerator Will Fire Markets, J. Authers, Bloomberg (January 14, 2021)
- Why the renminbi cannot rival the dollar yet, H. Lockett, Financial Times (January 13, 2021)
Chart talk: Technical & fundamental highlights
Choose pair:
EURUSD – technical overview
The recent breakout above 1.2000 ends a period of multi-week consolidation, with the major pair pushing to its highest level since April 2018. The break also opens the door for an eventual retest of the 2018 high up in the 1.2550 area. At this stage, any setbacks should be very well supported above the previous range low around 1.1600.EURUSD – fundamental overview
The Euro hasn't done much with the reports of President-elect Biden pushing $2 trillion in fiscal stimulus. This number is higher than estimates and it will be interesting to see how price action unfolds for the remainder of the day, with the news having the potential to fuel more US Dollar outflow. There continues to be worry around political instability in Italy, after ex-Premier Renzi pulled his Italy Alive party out of the governing alliance. Key standouts on today’s calendar include German growth data, the ECB Minutes, US initial jobless claims, and a Fed Powell speech.EURUSD - Technical charts in detail
GBPUSD – technical overview
The recent breakout through the 2019 high at 1.3515 is significant and now sets the stage for the next major upside extension back towards 1.4000. Technical studies are running a little stretched on the daily chart and as such, there is room for some setbacks before the market starts to make its way higher. But look for setbacks to now be very well supported ahead of 1.3000.GBPUSD – fundamental overview
We haven't seen much from the Pound, after the currency was supported earlier in the week on BOE Governor Bailey comments, after the central banker dismissed the prospect of moving to negative rate policy, given major concerns about its effectiveness and risks it pose on the banks. Key standouts on today’s calendar include US initial jobless claims, and a Fed Powell speech.USDJPY – technical overview
The latest breakdown below 104.00 opens the door for a deeper round of setbacks. Initial support comes in just ahead of 101.00, in the form of the 2020 low, which guards against the major psychological barrier at 100.00 and the 2016 low around 99.00. At this point, it would take a clear break back above 106.00 to take the immediate pressure off the downside.USDJPY – fundamental overview
In a virtual meeting of BOJ branch managers, Governor Kuroda said that Japan's economic conditions "remain severe" as a result of the surge in coronavirus infections both home and abroad, but that "we have seen a pickup" and "is likely to improve as a trend as the impact from the pandemic gradually subsides." Kuroda however again warned that the pace of recovery will be "moderate," and that the BOJ still stands ready to ease monetary policy if necessary. Key standouts on today’s calendar include US initial jobless claims, and a Fed Powell speech.EURCHF – technical overview
Lots of sideways price action here, with no clear directional insight. For the most part, price action has been confined between 1.0600 and 1.0900, and it will take a clear break above or below for an indication of the next big move.EURCHF – fundamental overview
The SNB remains uncomfortable with Franc appreciation and continues to remind the market it will need to be careful about any attempts at trying to force an appreciation in the currency. But the SNB will also need to be careful right now, as its strategy to weaken the Franc is facing headwinds from a less certain global outlook. Any signs of renewed risk liquidation will likely invite a very large wave of demand for the Franc that will put the SNB in the more challenging position of needing to back up its talk with action, that ultimately, may not prove to be as effective as it once was, given where we're at in the monetary policy cycle.AUDUSD – technical overview
Technical studies have turned up in recent months, after the market traded down to its lowest levels since 2003 in 2020. There is evidence of a longer-term bottom following the latest push back through 0.7000, though at this stage, there is risk for a pullback to allow for shorter term studies to unwind. Next big resistance comes in at 0.8000. Setbacks should now be well supported ahead of 0.6800.AUDUSD – fundamental overview
The Australian Dollar has done a good job holding up on Thursday, despite the news of the 8.9% decline in China's imports from Australia. Meanwhile, the RBA purchased AUD 2 billion of government bonds in today's operations. Key standouts on today’s calendar include US initial jobless claims, and a Fed Powell speech.USDCAD – technical overview
Has been in the process of correcting since topping out earlier this year above 1.4600. At this stage, with the correction well extended, the market is likely to find solid support into the 1.2500 area ahead of a resumption of gains. Ultimately, only a weekly close below 1.2500 would suggest otherwise.USDCAD – fundamental overview
Oil's ability to hold up and this week's stronger Canada business outlook indicator for Q4 have helped to mitigate setbacks in the Canadian Dollar that had come from broad based US Dollar demand on a downturn in sentiment. Key standouts on today’s calendar include US initial jobless claims, and a Fed Powell speech.NZDUSD – technical overview
There's a case to be made for a meaningful bottom, after the market bottomed out in 2020. The recent break back above 0.7000 further strengthens this outlook, with the market back in uptrend mode as per the weekly Ichimoku cloud and focused on pushing back towards longer-term resistance in the 0.7500 area. Any setbacks are expected to be well supported ahead of 0.6500.NZDUSD – fundamental overview
New Zealand's November building permits rose 1.2% month on month versus an upwardly revised 8.9% previous. Meanwhile, the RBNZ sold NZD 450 million of bonds in a multi-tranche offering that drew strong demand. Key standouts on today’s calendar include US initial jobless claims, and a Fed Powell speech.US SPX 500 – technical overview
Longer-term technical studies are looking quite exhausted and the market is showing signs of wanting to roll over after racing to another record high. Look for rallies to be well capped ahead of 3900, with a break back below 3600 to strengthen the outlook.US SPX 500 – fundamental overview
We're trading just off fresh record highs, and yet, with so little room for additional central bank accommodation, given an already depressed interest rate environment, the prospect for sustainable runs to the topside on easy money policy incentives and government stimulus, should no longer be as enticing to investors. Meanwhile, ongoing worry associated with coronavirus fallout should weigh more heavily on investor sentiment in 2021.GOLD (SPOT) – technical overview
The 2019 breakout above the 2016 high at 1375 was a significant development, opening the door for fresh record highs and an acceleration beyond the next major psychological barrier at 2000. Setbacks should now be well supported above 1700. Longer-term technical studies are however in the process of consolidating, with the market in search of a higher low ahead of a bullish continuation.GOLD (SPOT) – fundamental overview
The yellow metal continues to be well supported on dips with solid demand from medium and longer-term accounts. These players are more concerned about exhausted monetary policy, extended global equities, and coronavirus fallout. All of this should keep the commodity well supported, with many market participants also fleeing to the hard asset as the grand dichotomy of record high equities and record low yields comes to an unnerving climax.BTCUSD – technical overview
The short-term outlook should be less constructive in the aftermath of this latest wave of parabolic price action through $40,000. Key indicators are unwinding from extreme overbought territory across multiple timeframes, warning of a period of deeper correction and consolidation before any meaningful bullish continuation can be expected. At the same time, look for setbacks to now be well supported into the $20,000 area.BTCUSD – fundamental overview
The break of 30k has turned heads and talk of the asset still being grossly undervalued has inspired another surge in demand through 40,000. Overall, ongoing adoption, continued innovation in the space, a warmer regulatory environment and healthy institutional investor appetite have all contributed to this latest wave of strong demand leading to fresh record highs into 2021. Market participants are also drawn to the asset as it proves to be an attractive store of value at a time when governments and central banks continue to print money at unprecedented rates.BTCUSD - Technical charts in detail
ETHUSD – technical overview
The market has raced up to its highest levels since January 2018, with the break opening this next major upside extension towards the record high at 1420. At the same time, with daily studies showing overextension, there could be a period of consolidation and deeper correction that sets in before a meaningful bullish continuation. Setbacks should now be well supported into the 600-800 area.ETHUSD – fundamental overview
Bitcoin is getting all of the attention, though it's Ether that outperformed its older cousin in 2020. All of the healthy investor risk appetite in global markets has helped to fuel demand for innovation and the Ethereum blockchain is very much at the centre of this when it comes to cryptocurrencies. At the same time, we would be concerned about a bubble in the defi space, with valuations for these projects soaring to alarming heights. We've also warned that any downturn in global sentiment is likely to have a more significant negative impact on the more risk correlated Ether.