


Next 24 hours: It's really quiet out there
Today’s report: Market Waiting on Thursday's US Inflation Reads
We’ve been seeing a lot of sideways price action in markets this week and it seems as though a lot of this could have something to do with the market waiting for more clarity from economic data in the form of tomorrow’s inflation readings out of the US.
Wake-up call
- German data
- UK reopening
- BOJ Amamiya
- Softer data
- Canada trade
- Kiwi hit
- Stocks vulnerable
- Dealers report
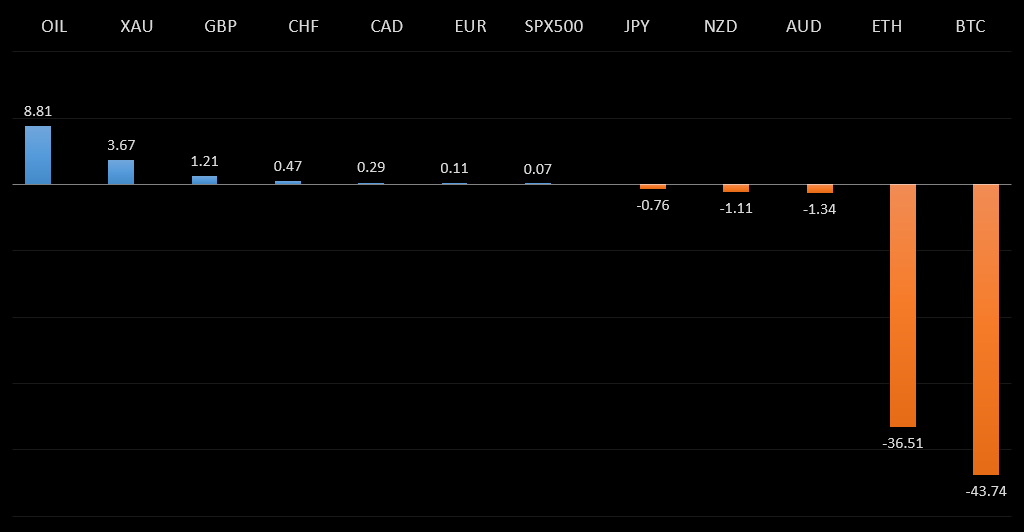
Peformance chart: 30 Day Performance vs. US dollar (%)
Suggested reading
- Stocks Aren't Always Right About Latin Populists, J. Authers, Bloomberg (June 9, 2021)
- Getting the Goalpost to Stop Moving, M. Housel, Collaborative Fund (June 7, 2021)
Chart talk: Technical & fundamental highlights
Choose pair:
EURUSD – technical overview
The market has been looking for a higher low since topping out in 2021 up at 1.2350. Ideally, this next higher low is sought out ahead of 1.1600 in favour of the next major upside extension back through 1.2350 and towards a retest of the 2018 high at 1.2555 further up.EURUSD – fundamental overview
Misses on German industrial production and ZEW expectations were behind the latest round of weakness in the Euro. Key standouts on today’s calendar come in the form of German trade, the Bank of Canada policy decision and US wholesale inventories.EURUSD - Technical charts in detail
GBPUSD – technical overview
Technical studies are in the process of consolidating from stretched levels after the push to fresh multi-month highs. This leaves room for additional consolidation, before the market considers a meaningful bullish continuation towards a retest of the 2018 high. But look for setbacks to now be very well supported into the 1.3500 area.GBPUSD – fundamental overview
The Times report of a delay of the reopening in the UK was behind some of the selling in the Pound on Tuesday. Meanwhile, BOE Haldane was out saying the housing boom fueled a wider equality gap. Key standouts on today’s calendar come in the form of German trade, the Bank of Canada policy decision and US wholesale inventories.USDJPY – technical overview
The major pair has run into massive resistance in the form of the monthly Ichimoku cloud, and has since stalled out. This translates to a longer-term trend that is still bearish despite the run up we saw in 2021, with risk for deeper setbacks ahead. It would take a clear break back above 113.00 to negate the outlook.USDJPY – fundamental overview
On Tuesday, Japan GDP numbers came in less worse than expected. BOJ Amamiya was on the wires warning that consumers may remain cautoius and that the central bank will ease further if necessary. Key standouts on today’s calendar come in the form of German trade, the Bank of Canada policy decision and US wholesale inventories.AUDUSD – technical overview
Technical studies have turned up in recent months, after the market traded down to its lowest levels since 2003 in 2020. There is evidence of a longer-term bottom following the latest push back through 0.7000, though at this stage, there is risk for a deeper pullback to allow for shorter term studies to unwind. Setbacks should now be well supported ahead of 0.7400.AUDUSD – fundamental overview
Economic data out of Australia has been less impressive this week and has been behind some of the mild selling pressure we've been seeing. Key standouts on today’s calendar come in the form of German trade, the Bank of Canada policy decision and US wholesale inventories.USDCAD – technical overview
Has been in major decline since topping out in 2021 above 1.4600. At this stage, with the decline now well extended, the market is likely to find solid support into the 1.2000 area ahead of a resumption of gains. Ultimately, only a weekly close below 1.2000 would suggest otherwise. Back above 1.2352 will strengthen the outlook.USDCAD – fundamental overview
The Canadian Dollar remained under pressure on Tuesday and has been an underperformer of late. Tuesday's weakness came on account of the much weaker than expected Canada trade data. Key standouts on today’s calendar come in the form of German trade, the Bank of Canada policy decision and US wholesale inventories.NZDUSD – technical overview
The market has been very well supported in recent months and there is evidence of a longer-term base. Look for setbacks to hold up above 0.7100, with sights set on a run back towards the 0.7500 area.NZDUSD – fundamental overview
The New Zealand Dollar has been finding more offers into rallies of late. It seems the currency has been capped on less demand for commodities and worry associated with broader risk sentiment. We've also seen some selling on softer local data. Key standouts on today’s calendar come in the form of German trade, the Bank of Canada policy decision and US wholesale inventories.US SPX 500 – technical overview
Longer-term technical studies are looking quite exhausted and the market is showing signs of wanting to roll over after racing to another record high. Look for rallies to be well capped above of 4200, with a break back below 4000 to strengthen the outlook.US SPX 500 – fundamental overview
We're trading just off fresh record highs, and yet, with so little room for additional central bank accommodation, given an already depressed interest rate environment, the prospect for sustainable runs to the topside on easy money policy incentives and government stimulus, should no longer be as enticing to investors. Meanwhile, ongoing worry associated with coronavirus fallout and risk of rising inflation should weigh more heavily on investor sentiment into the second half of 2021.GOLD (SPOT) – technical overview
The 2019 breakout above the 2016 high at 1375 was a significant development, opening the door for fresh record highs and an acceleration beyond the next major psychological barrier at 2000. Setbacks should now be well supported above 1600.GOLD (SPOT) – fundamental overview
The yellow metal continues to be well supported on dips with solid demand from medium and longer-term accounts. These players are more concerned about exhausted monetary policy, extended global equities, and coronavirus fallout. All of this should keep the commodity well supported, with many market participants also fleeing to the hard asset as the grand dichotomy of record high equities and record low yields comes to an unnerving climax.