


Next 24 hours: US equity futures under pressure
Today’s report: When too much bad news is simply bad news
We’ve seen a tremendous amount of success around the bad news is good news narrative. But sometimes, too much bad news can actually still have the intuitive impact of shaking up the market.
Wake-up call
- ECB Villeroy
- inflation data
- BOJ letdown
- soft employment
- Odds leaning
- shock resignation
- Inflation headache
- Dealers report
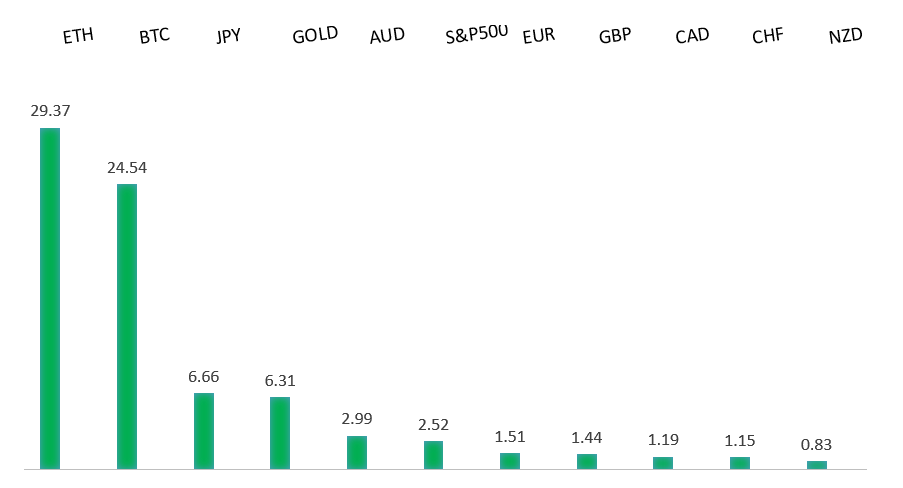
Peformance chart: 30 Day Performance vs. US dollar (%)
Suggested reading
- Look Who’s Emerging as the Biggest Star of 2023, J. Authers, Bloomberg (January 19, 2023)
- Why Stakeholder Capitalism is Under Attack, S. Mundy, Financial Times (January 17, 2023)
Chart talk: Technical & fundamental highlights
Choose pair:
EURUSD – technical overview
The Euro recovery has finally run back above meaningful previous support turned resistance at 1.0635. The December close above this level further encourages the recovery outlook and makes a stronger case for the formation of a longer-term bottom. Any setbacks should now be well supported ahead of 1.0300. Next major resistance at 1.1000.EURUSD – fundamental overview
The Euro extended its run on Wednesday, with the currency pushing higher after ECB Villeroy pushed back against a story the central bank would be looking to slow the pace of rate hikes. However, risk off flow into the end of the day opened the door for profit taking and a pullback. Key standouts on Thursday’s calendar come from the Eurozone current account, an ECB Lagarde speech, the ECB Minutes, and US data in the form of building permits, the Philly Fed, housing starts, and initial jobless claims.EURUSD - Technical charts in detail
GBPUSD – technical overview
Signs have emerged of the market wanting to put in a longer-term base after collapsing to a record low in September. The latest weekly close back above the September high at 1.1739 strengthens this prospect. Any setbacks should now be well supported ahead of 1.1500. Next key resistance comes in at 1.2668.GBPUSD – fundamental overview
The Pound was an outperformer in Wednesday trade after UK inflation data came in above forecast, pushing up BOE rate hike expectations. Key standouts on Thursday’s calendar come from the Eurozone current account, an ECB Lagarde speech, the ECB Minutes, and US data in the form of building permits, the Philly Fed, housing starts, and initial jobless claims.USDJPY – technical overview
The major pair has been in the throes of a long overdue correction that was waiting to play out after a parabolic run to the topside to multi-year highs. At this stage, the correction could be getting close to having played out fully, with the market finally approaching critical previous resistance turned support in the 125.00 area.USDJPY – fundamental overview
The Yen had initially sold off in the aftermath of a letdown BOJ decision in which the central bank left policy unchanged. However, with many out there anticipating the end of Kuroda's term and a shift in policy, the Yen was able to recover all of the setbacks. Key standouts on Thursday’s calendar come from the Eurozone current account, an ECB Lagarde speech, the ECB Minutes, and US data in the form of building permits, the Philly Fed, housing starts, and initial jobless claims.AUDUSD – technical overview
There are signs of the potential formation of a longer-term base following the recent surge back above 0.6500. The recent weekly close back above previous support now turned resistance at 0.6682 strengthens the outlook for a bullish structural shift. Next key resistance comes in at 0.7137.AUDUSD – fundamental overview
Lower stocks and a discouraging Aussie employment report have resulted in a healthy wave of selling in the Australian Dollar. Key standouts on Thursday’s calendar come from the Eurozone current account, an ECB Lagarde speech, the ECB Minutes, and US data in the form of building permits, the Philly Fed, housing starts, and initial jobless claims.USDCAD – technical overview
A recent surge back above 1.3000 signals an end to a period of bearish consolidation and suggests the market is in the process of carving out a more significant longer-term base. Next key resistance now comes in up into the 1.4000 area. Setbacks should be very well supported down into the 1.3000 area.USDCAD – fundamental overview
Risk off flow and a round of weak second tier data out of Canada have been behind the latest selloff in the currency. Key standouts on Thursday’s calendar come from the Eurozone current account, an ECB Lagarde speech, the ECB Minutes, and US data in the form of building permits, the Philly Fed, housing starts, and initial jobless claims.NZDUSD – technical overview
Overall pressure remains on the downside with risk for the current recovery rally to stall out and form a lower top for the next major downside extension. A break back above 0.6577 would be required to take the immediate pressure off the downside.NZDUSD – fundamental overview
New Zealand Prime Minister Jacinda Ardern announced she is stepping down in a shock resignation ahead of a general election later this year. The Labour caucus will vote on a new leader on January 22, with the winner needing two-thirds support. If no one has that, the contest will go to the wider party membership. It is expected the process will conclude no later than February 7. Key standouts on Thursday’s calendar come from the Eurozone current account, an ECB Lagarde speech, the ECB Minutes, and US data in the form of building permits, the Philly Fed, housing starts, and initial jobless claims.US SPX 500 – technical overview
Longer-term technical studies are in the process of unwinding from extended readings off record highs. Look for rallies to be well capped in favor of lower tops and lower lows. A monthly close back above 4300 will be required at a minimum to take the immediate pressure off the downside. Next major support comes in at 3492.US SPX 500 – fundamental overview
We've finally reached a point in the cycle where the Fed recognizes unanchored inflation expectations pose a greater downside risk than over-tightening. This is significant, as it means less investor friendly monetary policy that risks potential recession in the months ahead. Overall, we expect inflation to continue to be a problem in H1 2023 that results in downside pressure into rallies.GOLD (SPOT) – technical overview
The 2019 breakout above the 2016 high at 1375 was a significant development, opening the door for fresh record highs. Setbacks should now be well supported above 1600 on a monthly close basis ahead of the next major upside extension. The recent break back above 1808 strengthens the bullish outlook. Next major resistance comes in at 2000.GOLD (SPOT) – fundamental overview
The yellow metal continues to be well supported on dips with solid demand from medium and longer-term accounts. These players are more concerned about inflation risk and a less upbeat global growth outlook. All of this should keep the commodity well supported, with many market participants also fleeing to the hard asset as the grand dichotomy of record high equities and record low yields comes to an unnerving climax.