


Today’s report: Bad news versus too much bad news
The stock market continues to try and hang on to whatever it can to keep the momentum going into the end of the week, though there are potential cracks at the surface. Certainly, when looking over at the currency market, we’re getting a different message.
Wake-up call
- Cautious comments
- peak rates
- Carry unwind
- deteriorating sentiment
- Friday risk
- house prices
- inflation risk
- Dealers report
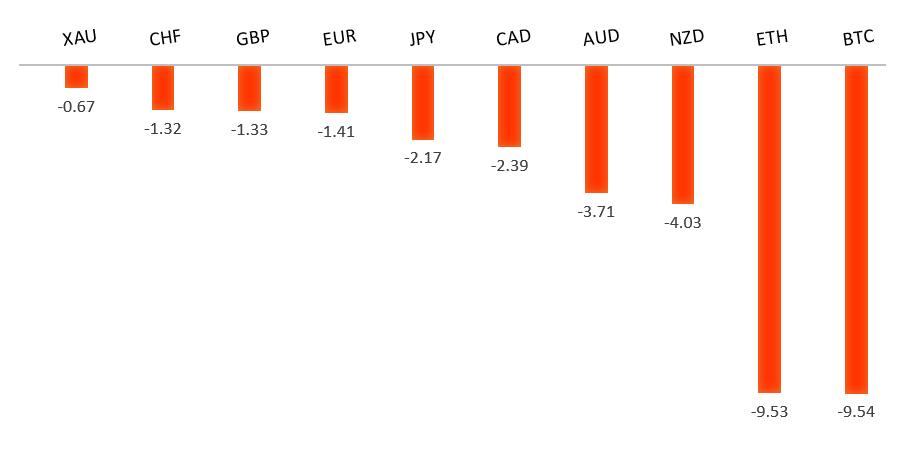
Peformance chart: 30 Day Performance vs. US dollar (%)
Suggested reading
- IPO Drought Is Ending, But Don’t Expect a Deluge, J. Levin, Bloomberg (August 31, 2023)
- What Buffett Accomplished After The Age of 65, R. Nagarajan, Rational Walk (August 30, 2023)
Chart talk: Technical & fundamental highlights
Choose pair:
EURUSD – technical overview
The Euro remains well supported on dips following a run to the topside through 1.1000. Any additional setbacks should be well supported ahead of 1.0500 in favor of a bullish continuation. Ultimately, only a monthly close back below 1.0500 would give reason for concern. Next key resistance comes in the form of the 2023 high at 1.1276.EURUSD – fundamental overview
The Euro has come back under pressure on the back of cautious comments from noted ECB hawk Schnabel and a discouraging German retail sales print. Market odds for a September rate hike have plunged to around 25% from more than 50% earlier in the week. Key standouts on Friday’s calendar come from German, Eurozone, and UK manufacturing PMI reads, Canada GDP, the monthly employment report out of the US, Canada manufacturing PMIs, US ISM manufacturing, and US construction spending.EURUSD - Technical charts in detail
GBPUSD – technical overview
Signs have emerged of the market wanting to put in a longer-term base after collapsing to a record low in September 2022. The November 2022 monthly close back above 1.2000 strengthens this prospect. Any setbacks should now be well supported ahead of 1.2500. Next key resistance comes in at 1.3143.GBPUSD – fundamental overview
The Pound continues to hold up relatively well despite recent setbacks against the US Dollar. Overall, UK rates are still maintaining an advantage given upwards pressure on inflation. A September rate hike is no longer a sure thing but UK peak rates still sit at the highest level in the G10. Key standouts on Friday’s calendar come from German, Eurozone, and UK manufacturing PMI reads, Canada GDP, the monthly employment report out of the US, Canada manufacturing PMIs, US ISM manufacturing, and US construction spending.USDJPY – technical overview
At this stage, it looks like the market is wanting to resume the bigger picture uptrend and head back towards a retest of that multi-year high from October 2022 up at 151.95. Look for any weakness to continue to be well supported on dips.USDJPY – fundamental overview
The Yen has managed to overcome a round of softer economic data as carry trade unwind becomes a mini theme into the end of the week. Key standouts on Friday’s calendar come from German, Eurozone, and UK manufacturing PMI reads, Canada GDP, the monthly employment report out of the US, Canada manufacturing PMIs, US ISM manufacturing, and US construction spending.AUDUSD – technical overview
There are signs of the potential formation of a longer-term base following the late 2022 surge back above 0.6500. Next key resistance comes in at 0.7284. Setbacks should continue to be well supported ahead of 0.6300. Only a monthly close below 0.6400 would give reason for rethink.AUDUSD – fundamental overview
Aussie rallies on the back of China actions and a recovery in the Yuan have stalled out, and the currency has come back under pressure into Friday as global risk sentiment erodes. Key standouts on Friday’s calendar come from German, Eurozone, and UK manufacturing PMI reads, Canada GDP, the monthly employment report out of the US, Canada manufacturing PMIs, US ISM manufacturing, and US construction spending.USDCAD – technical overview
Above 1.3000 signals an end to a period of longer-term bearish consolidation and suggests the market is in the process of carving out a more significant longer-term base. Next key resistance now comes in up into the 1.4000 area. Setbacks should be very well supported down into the 1.3000 area.USDCAD – fundamental overview
Mixed commodities price action has kept the Canadian Dollar mostly sideways heading into a busy calendar Friday. Key standouts on Friday’s calendar come from German, Eurozone, and UK manufacturing PMI reads, Canada GDP, the monthly employment report out of the US, Canada manufacturing PMIs, US ISM manufacturing, and US construction spending.NZDUSD – technical overview
Overall pressure remains on the downside with the market once again stalling out on a run up into the 0.6500 area. Ultimately, a break back above 0.6577 would be required to take the immediate pressure off the downside. A monthly close below 0.6000 would intensify bearish price action.NZDUSD – fundamental overview
The New Zealand Dollar has done a better job holding up against the US Dollar demand than its peers. The New Zealand activity outlook and business confidence reads were less bad, while house prices improved. Key standouts on Friday’s calendar come from German, Eurozone, and UK manufacturing PMI reads, Canada GDP, the monthly employment report out of the US, Canada manufacturing PMIs, US ISM manufacturing, and US construction spending.US SPX 500 – technical overview
Longer-term technical studies are in the process of unwinding from extended readings off record highs. Look for rallies to be well capped in favor of lower tops and lower lows. A monthly close back above 4600 will be required to take the immediate pressure off the downside. Next key support comes in at 4328.US SPX 500 – fundamental overview
We've finally reached a point in the cycle where the Fed recognizes unanchored inflation expectations pose a greater downside risk than over-tightening. This is significant, as it means less investor friendly monetary policy. Overall, we expect inflation to continue to be a problem in 2023 that results in downside pressure into rallies despite market expectations that would argue otherwise.GOLD (SPOT) – technical overview
The 2019 breakout above the 2016 high at 1375 was a significant development, opening the door for fresh record highs. Setbacks should now be well supported above 1600 on a monthly close basis ahead of the next major upside extension. Next major resistance comes in at 2100, above which opens the next extension towards 2500.GOLD (SPOT) – fundamental overview
The yellow metal continues to be well supported on dips with solid demand from medium and longer-term accounts. These players are more concerned about inflation risk and a less upbeat global growth outlook. All of this should keep the commodity well supported, with many market participants also fleeing to the hard asset as the grand dichotomy of record high equities and record low yields comes to an unnerving climax.