


 | ||
| 2nd June 2026 | view in browser | ||
| Pricing hope, hedging reality | ||
| Markets remain cautiously risk-sensitive as investors balance hopes for a US-Iran breakthrough against persistent geopolitical uncertainty, with elevated oil prices, yen intervention-watch, sticky inflation concerns, and softer equity futures driving a defensive tone across global assets. | ||
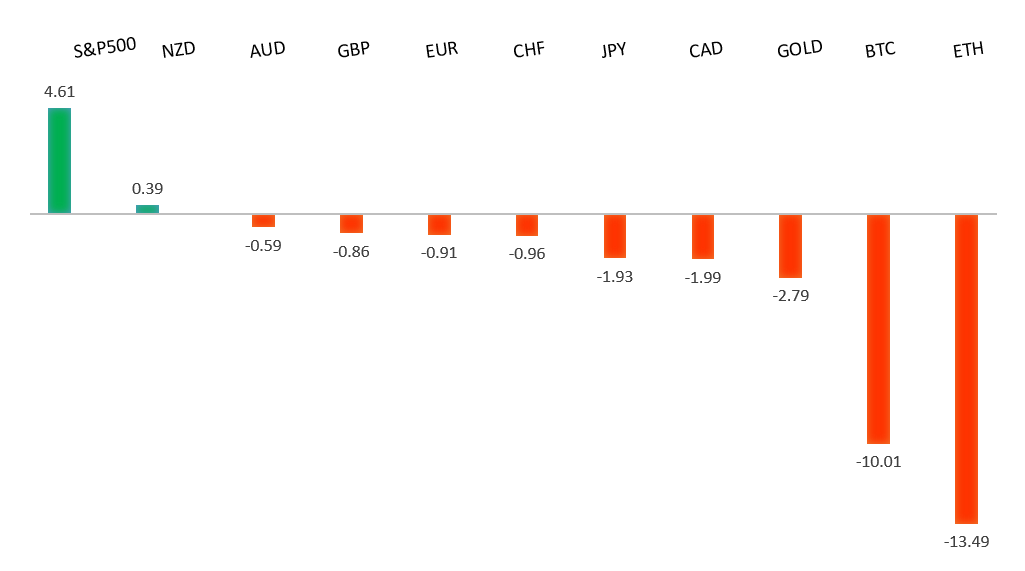
| Performance chart 30day v. USD (%) | ||
 | ||
| Technical & fundamental highlights | ||
| EURUSD: technical overview | ||
| The Euro outlook remains constructive with higher lows sought out on dips in favor of the next major upside extension targeting the 2021 high at 1.2350. Setbacks should be exceptionally well supported ahead of 1.1300. | ||
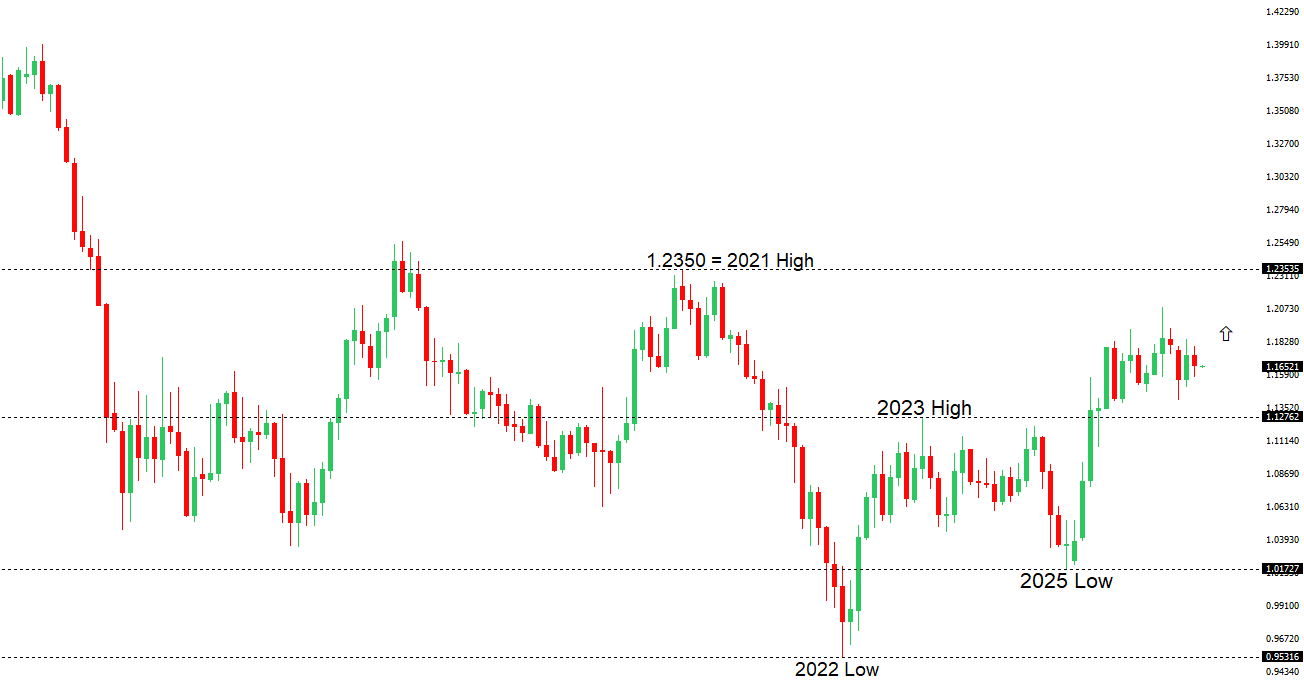 | ||
| R2 1.1797 - 6 May high - Medium R1 1.1722 - 14 May high - Medium S1 1.1576 - 21 May low - Medium S2 1.1504 - 3 April low - Strong | ||
| EURUSD: fundamental overview | ||
| The euro has remained well-supported above 1.16, driven primarily by a more hawkish shift in ECB expectations as policymakers grow increasingly concerned that the inflationary impact of elevated energy prices linked to Middle East tensions is broadening beyond the energy sector. ECB Executive Board member Isabel Schnabel has argued that the central bank can no longer look through the inflation shock, warning of rising risks of second-round effects and unanchored inflation expectations, prompting markets to price in additional rate hikes this year. Attention is now firmly on the latest Eurozone HICP release, with headline inflation expected to accelerate further after rising to 3.0% in April, reinforcing the view that price pressures remain well above the ECB’s 2% target. Recent national inflation readings from major economies including Spain and France have also surprised on the upside, adding to expectations that the ECB will maintain a tightening bias. At the same time, ongoing geopolitical uncertainty surrounding the Israel-Iran conflict, risks to global energy supply routes, and developments around the Strait of Hormuz continue to fuel concerns over persistent inflation pressures, helping underpin the euro even as broader risk sentiment remains fragile. | ||
| USDJPY: technical overview | ||
| There are signs of the formation of a meaningful top after the market put in a multi-year high in 2024. At this point, rallies should be well capped above 160.00 in favor of a fresh down-leg back towards the 2024 low at 139.58. Only a monthly close above 160.00 negates. | ||
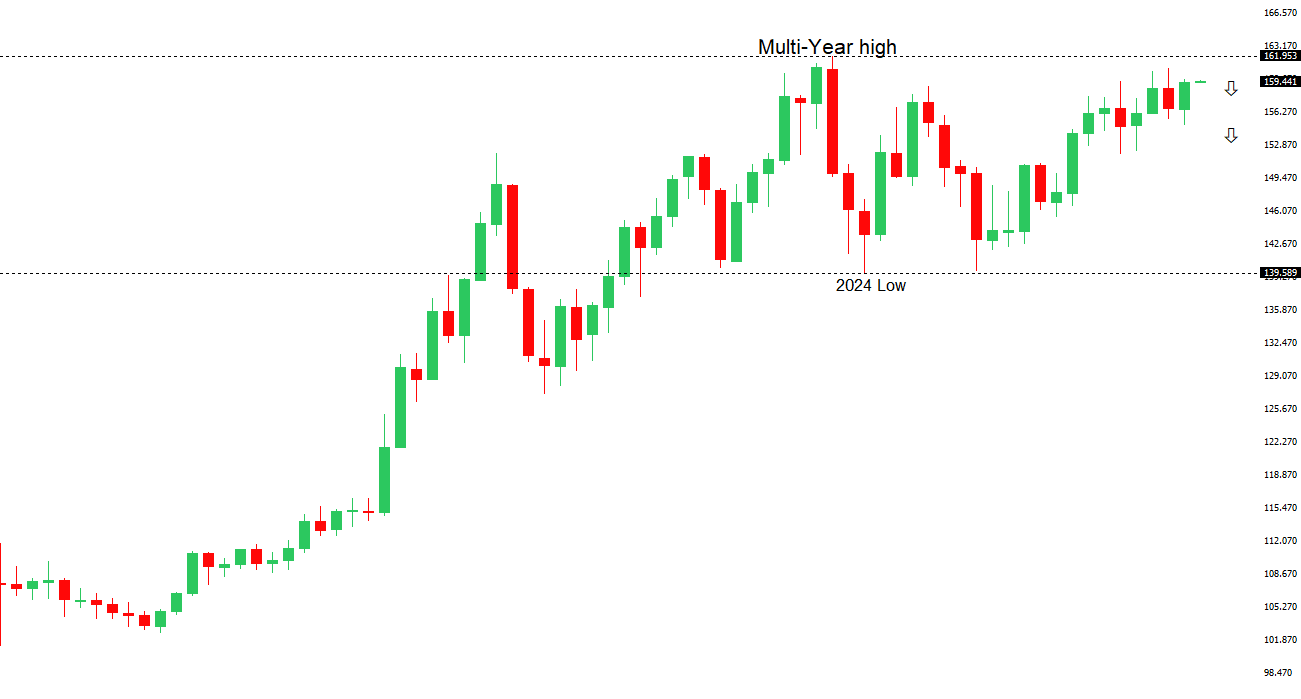 | ||
| R2 160.00 - Psychological - Strong R1 159.77 - 1 June high - Medium S1 158.59 - 20 May low - Medium S2 157.29 - 14 May low - Medium | ||
| USDJPY: fundamental overview | ||
| The yen remains under pressure as markets continue to focus on the wide policy divergence between the Federal Reserve and Bank of Japan, with USDJPY pushing back toward the 160 level despite growing expectations for a BoJ rate hike at the June 15-16 meeting. While BoJ Governor Ueda has maintained a hawkish tone, warning about second-round inflation effects from higher energy prices, and market participants increasingly expect another rate increase alongside further policy normalization, these supportive factors for the yen have been offset by rising concerns over Japan’s vulnerability to elevated oil prices amid ongoing Middle East tensions. Higher energy costs are seen as a drag on Japan’s import-dependent economy even as they boost inflation. At the same time, resilient US economic data and persistent inflation concerns have reinforced expectations that US rates will remain higher for longer, sustaining favorable yield differentials for the dollar. Japanese authorities have also stepped up verbal intervention, with Finance Minister Katayama stressing close monitoring of markets and coordination with US counterparts, helping to curb speculative yen selling as traders remain wary of potential intervention should USDJPY extend gains beyond current levels. Meanwhile, rising Japanese government bond yields, with 10-year JGB yields at multi-decade highs, have fueled debate over the pace of BoJ normalization, with major financial institutions arguing that a clear roadmap for future tightening will be just as important as the June rate decision in restoring confidence in the yen. | ||
| AUDUSD: technical overview | ||
| There are signs of the formation of a longer-term base with the market recovering out from a meaningful longer-term support zone. The latest monthly close back above 0.7000 takes the big picture pressure off the downside and strengthens the case for a bottom, with the focus now on a push towards 0.8000. Setbacks should now be well supported ahead of 0.6700. | ||
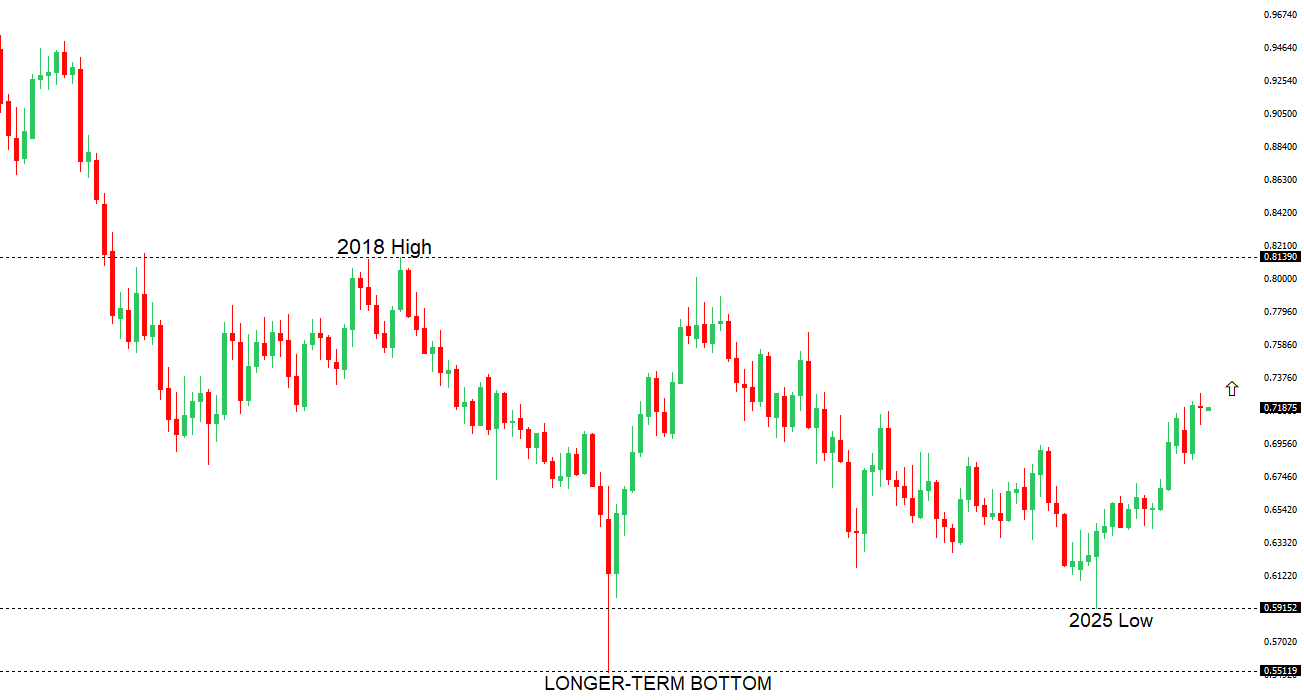 | ||
| R2 0.7278 - 6 May/2026 high - Strong R1 0.7222 - 17 April high - Medium S1 0.7079 - 19 May low - Medium S2 0.6963 - 8 April low - Strong | ||
| AUDUSD: fundamental overview | ||
| The Australian Dollar has come under modest pressure in recent sessions as investors reassess the domestic growth outlook ahead of Wednesday’s Q1 GDP release. A weaker-than-expected current account report, which showed the deficit widening to A$27.1 billion, alongside softer company profit data, reinforced concerns that growth momentum is slowing, with net exports now expected to subtract around 0.8 percentage points from quarterly GDP and government spending contributing little support. At the same time, signs of cooling domestic demand, including softer household consumption, a gradually weakening labor market and flat housing prices, suggest the Reserve Bank of Australia’s earlier tightening is beginning to bite. However, AUD downside remains tempered by the RBA’s still-hawkish policy stance, with sticky underlying inflation, rising wage pressures following Australia’s 4.75% minimum wage increase, and expectations from some banks for a further 25bp rate hike in August helping to support yield differentials. More broadly, the currency continues to take direction from global risk sentiment, developments in the Middle East and China’s economic performance, with China acting more as a stabilizing influence than a major growth tailwind for Australia. Overall, while softer near-term growth expectations have weighed on the AUD, the prospect of higher-for-longer Australian interest rates continues to provide an important fundamental offset. | ||
| Suggested reading | ||
| What Is The Optimal Number of Positions In A Portfolio?, B. Gilbert, Carson Group (May 27, 2026) The Impact of AI on the Economy and Markets, T. Slok, Apollo (May 28, 2026) | ||