


 | ||
| 3rd June 2026 | view in browser | ||
| Tariffs, tankers and turbulence | ||
| Markets remain dominated by a toxic mix of escalating Middle East conflict, rising oil prices, and the resurgence of Trump’s tariff agenda, supporting the US dollar and crude while raising stagflation risks and leaving investors increasingly cautious on global growth and risk assets. | ||
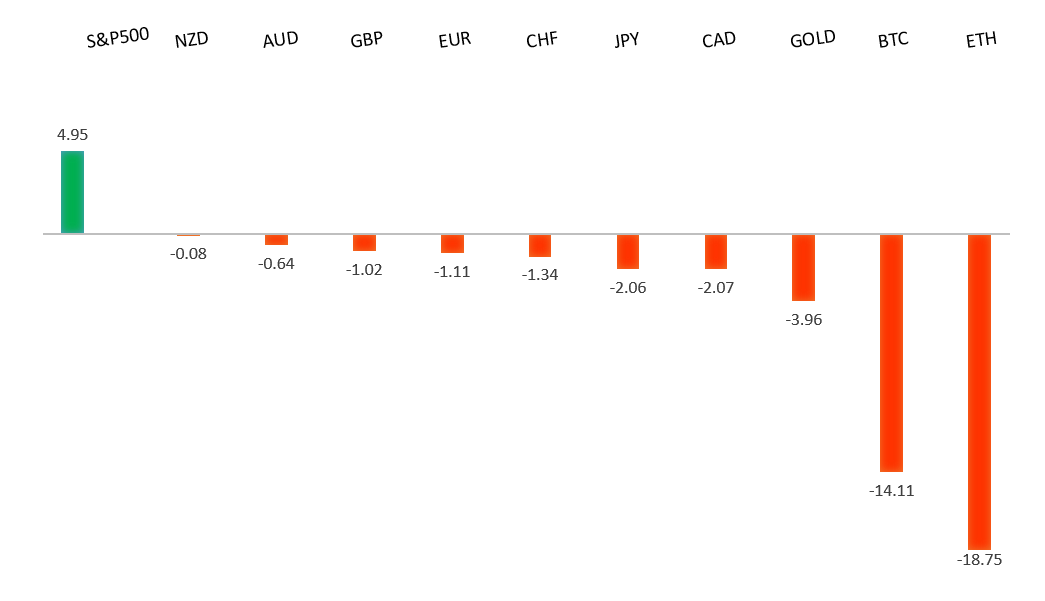
| Performance chart 30day v. USD (%) | ||
 | ||
| Technical & fundamental highlights | ||
| EURUSD: technical overview | ||
| The Euro outlook remains constructive with higher lows sought out on dips in favor of the next major upside extension targeting the 2021 high at 1.2350. Setbacks should be exceptionally well supported ahead of 1.1300. | ||
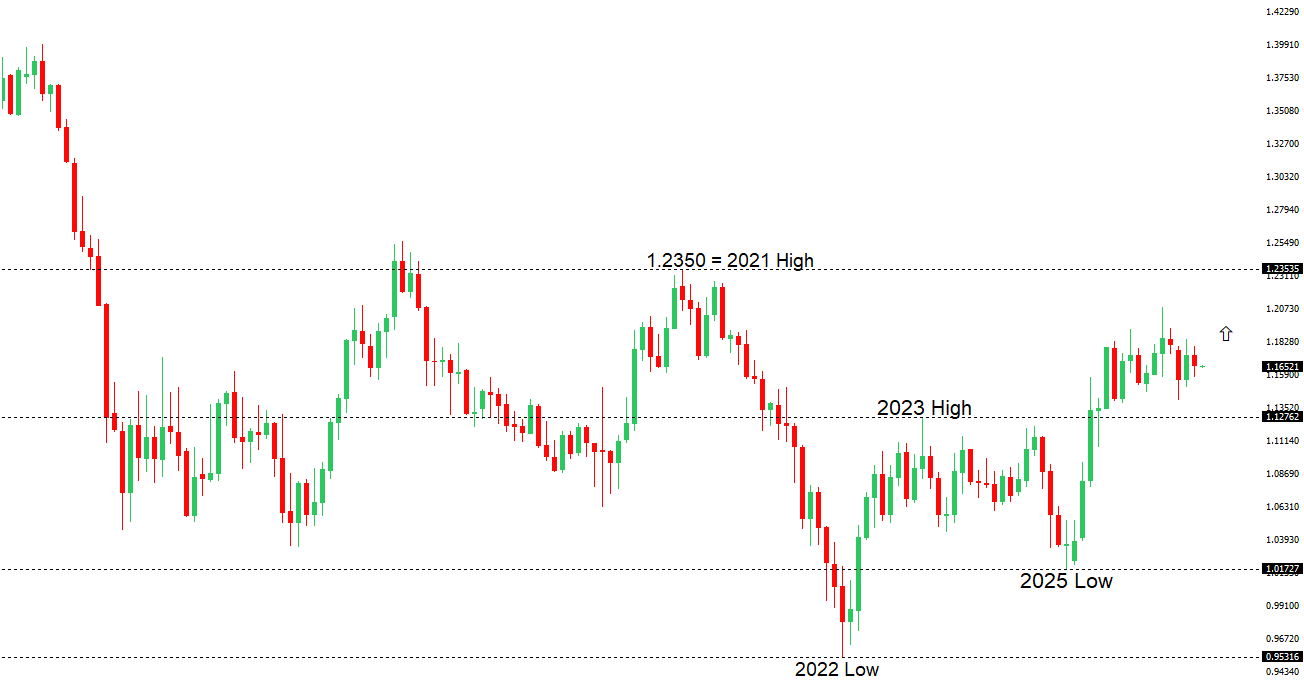 | ||
| R2 1.1797 - 6 May high - Medium R1 1.1722 - 14 May high - Medium S1 1.1576 - 21 May low - Medium S2 1.1504 - 3 April low - Strong | ||
| EURUSD: fundamental overview | ||
| The euro has remained relatively well supported on the fundamentals, underpinned by a renewed hawkish shift in ECB expectations after Eurozone inflation surprised to the upside in May, with headline HICP accelerating to 3.2% year-over-year. Recent comments from ECB officials have reinforced the view that policymakers remain concerned about inflation risks, particularly against the backdrop of higher energy prices stemming from escalating Middle East tensions and the closure of the Strait of Hormuz. ECB Governing Council members Olli Rehn, Gediminas Simkus and Pierre Wunsch have all signaled support for a June rate hike, with Wunsch noting that the case for tightening remains compelling if geopolitical tensions persist and warning against relying solely on market pricing to do the ECB’s work. At the same time, the euro’s gains have been tempered by a broader risk-off environment that has boosted demand for the US dollar as a safe haven. Stronger-than-expected US data, including a rise in ISM manufacturing activity to its highest level since 2022 and a sharp increase in job openings, has reinforced the narrative of higher-for-longer Fed policy, limiting EURUSD upside despite increasingly hawkish ECB rhetoric. Overall, markets continue to balance a more restrictive ECB outlook against the support being generated for the dollar from geopolitical uncertainty and resilient US economic performance. | ||
| USDJPY: technical overview | ||
| There are signs of the formation of a meaningful top after the market put in a multi-year high in 2024. At this point, rallies should be well capped above 160.00 in favor of a fresh down-leg back towards the 2024 low at 139.58. Only a monthly close above 160.00 negates. | ||
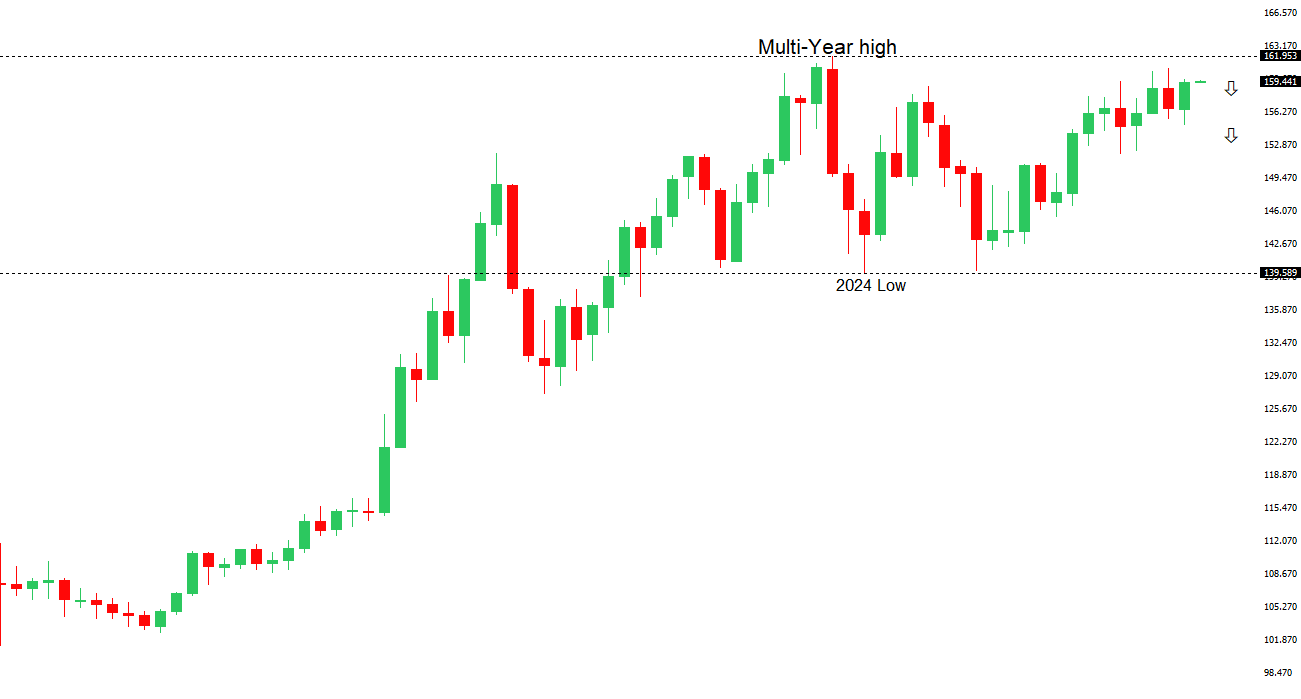 | ||
| R2 160.73 - 30 April/2026 high - Strong R1 160.00 - Psychological - Strong S1 158.59 - 20 May low - Medium S2 157.29 - 14 May low - Medium | ||
| USDJPY: fundamental overview | ||
| The yen remains under broad pressure, with USDJPY once again testing the key 160 area as the wide US-Japan rate differential continues to favor the dollar, particularly against a backdrop of resilient US data and expectations that the Federal Reserve will keep policy restrictive for longer. At the same time, the Bank of Japan has been slow to normalize policy despite underlying inflation remaining above target and growing speculation that it could deliver another rate hike this month. Rising Middle East tensions and elevated oil prices have added another headwind for the yen, given Japan’s heavy reliance on imported energy, worsening the terms-of-trade impact and increasing demand for dollars. While safe-haven flows would normally support the yen, geopolitical uncertainty has instead reinforced demand for the US dollar as the world’s primary reserve currency. Against this backdrop, markets are increasingly focused on the risk of official intervention, with Japanese authorities reiterating their readiness to act against excessive or speculative currency moves after spending a record ¥11.7 trillion supporting the yen in late April and May. However, the limited and short-lived impact of previous intervention efforts suggests that without a more meaningful narrowing of yield differentials through further BOJ tightening, underlying yen weakness is likely to persist. | ||
| AUDUSD: technical overview | ||
| There are signs of the formation of a longer-term base with the market recovering out from a meaningful longer-term support zone. The latest monthly close back above 0.7000 takes the big picture pressure off the downside and strengthens the case for a bottom, with the focus now on a push towards 0.8000. Setbacks should now be well supported ahead of 0.6700. | ||
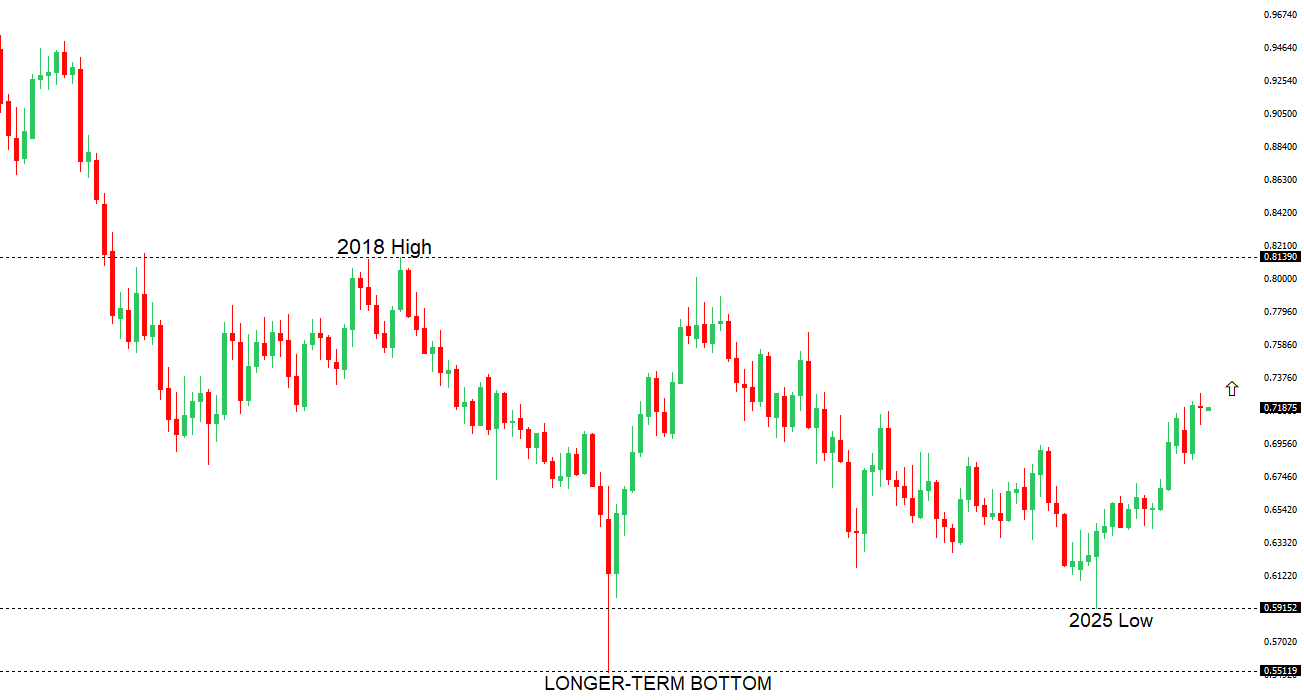 | ||
| R2 0.7278 - 6 May/2026 high - Strong R1 0.7222 - 17 April high - Medium S1 0.7079 - 19 May low - Medium S2 0.6963 - 8 April low - Strong | ||
| AUDUSD: fundamental overview | ||
| The Australian Dollar has come under renewed pressure after Q1 GDP growth slowed to just 0.3% q/q, undershooting expectations and reinforcing the view that the Australian economy is losing momentum amid elevated borrowing costs and softer domestic demand. The weaker growth backdrop has prompted markets to scale back expectations for additional RBA tightening, particularly against a backdrop of a cooling labor market and contracting services activity. At the same time, escalating Middle East tensions have boosted safe-haven demand for the US Dollar while raising concerns about the growth implications of persistently high energy prices for Australia. Offsetting some of these headwinds, China’s latest data have offered a constructive signal for Australia’s external outlook, with the May Caixin Services PMI jumping to 54.4 from 52.6, marking the fastest expansion in three months and highlighting resilient domestic demand and improving employment conditions. The strong Chinese services reading reinforces expectations that Beijing’s policy support measures are helping cushion the economy from global shocks, providing a degree of support for Australia’s commodity and export sectors. However, for now, the market appears more focused on weakening domestic Australian growth dynamics and reduced RBA rate expectations, leaving the AUD vulnerable despite the relatively encouraging China backdrop. | ||
| Suggested reading | ||
| Find Your Inner J.P. Morgan, Plus Be Patient, J. Calhoun, Alhambra (May 31, 2026) AI Will Create More Jobs, Not Fewer, T. Slok, Apollo (June 1, 2026) | ||