


 | ||
| 14th July 2026 | view in browser | ||
| CPI and Fed Chair testimony amplify risks | ||
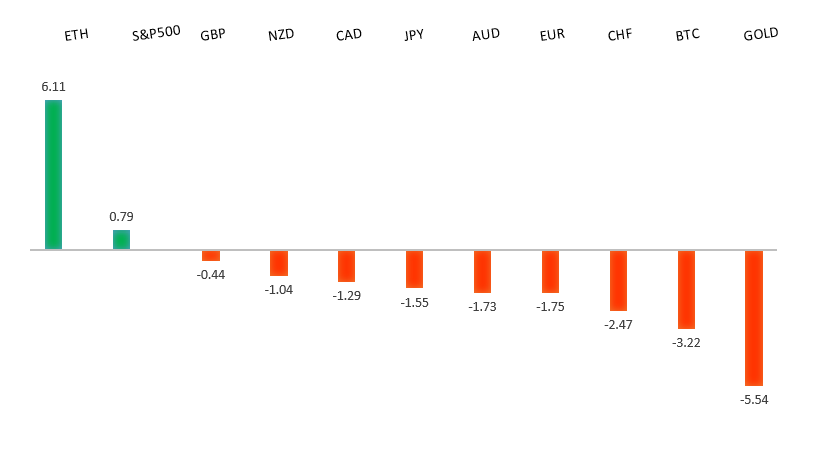
| Markets head into Tuesday with a defensive bias as escalating US-Iran tensions, surging oil prices and rising Fed rate expectations drive broad dollar strength, higher Treasury yields and pressure on global equities ahead of key US inflation data. | ||
| Performance chart 30day v. USD (%) | ||
 | ||
| Technical & fundamental highlights | ||
| EURUSD: technical overview | ||
| The Euro outlook remains constructive with higher lows sought out on dips in favor of the next major upside extension targeting the 2021 high at 1.2350. Setbacks should be exceptionally well supported ahead of 1.1300. | ||
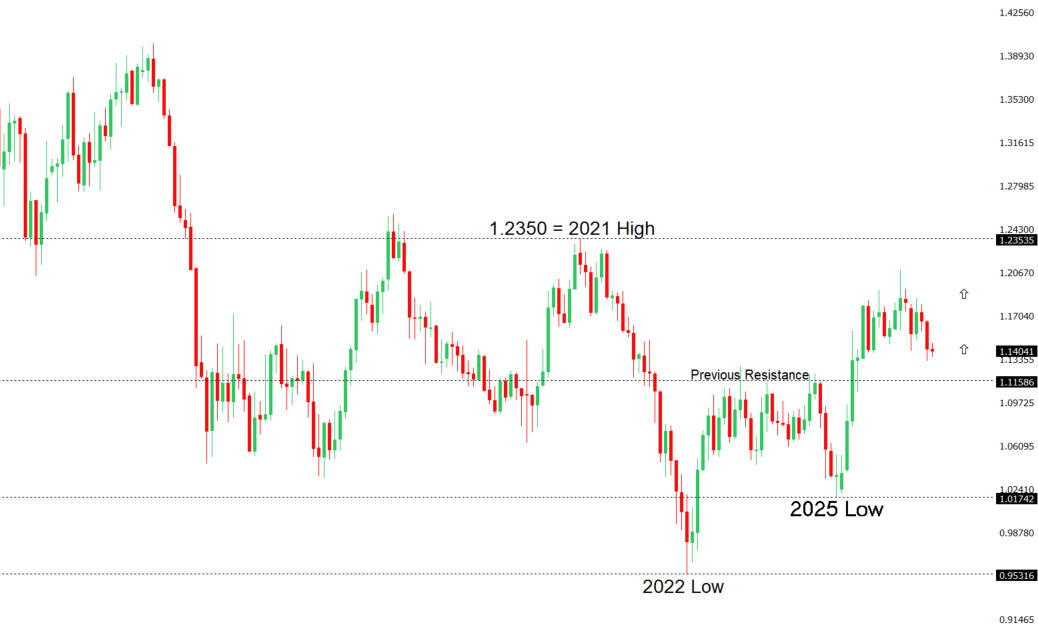 | ||
| R2 1.1529 - 18 June high - Medium R1 1.1473 - 2 July high - Medium S1 1.1325 - 24 June/2026 low - Medium S2 1.1300 - Figure - Medium | ||
| EURUSD: fundamental overview | ||
| The euro remains broadly supported by resilient Eurozone fundamentals and the ECB’s comparatively hawkish stance, though gains against the US dollar are proving difficult to extend ahead of key US inflation data. Markets continue to weigh the prospect that the ECB will keep policy restrictive for longer than many of its global peers, offering underlying support to the single currency. However, renewed geopolitical tensions following fresh US military strikes against Iran have boosted demand for traditional safe havens, lending support to the dollar and tempering euro upside. As a result, attention is now firmly on the latest US CPI report, with a softer-than-expected inflation reading likely to weigh on the dollar by reducing expectations for further Fed tightening, while a stronger print would reinforce the case for higher US rates and could see EURUSD come back under renewed pressure. | ||
| GBPUSD: technical overview | ||
| The Pound remains exceptionally well supported on dips into the 1.3000 area, with the price largely consolidating above the psychological barrier and previous resistance turned support in the form of the 2023 high. Look for the market to continue be well supported on dips ahead of the next major upside extension through the yearly high at 1.3870 and towards a retest of the 2018 high at 1.4377 further up. Only a monthly close below 1.3000 negates. | ||
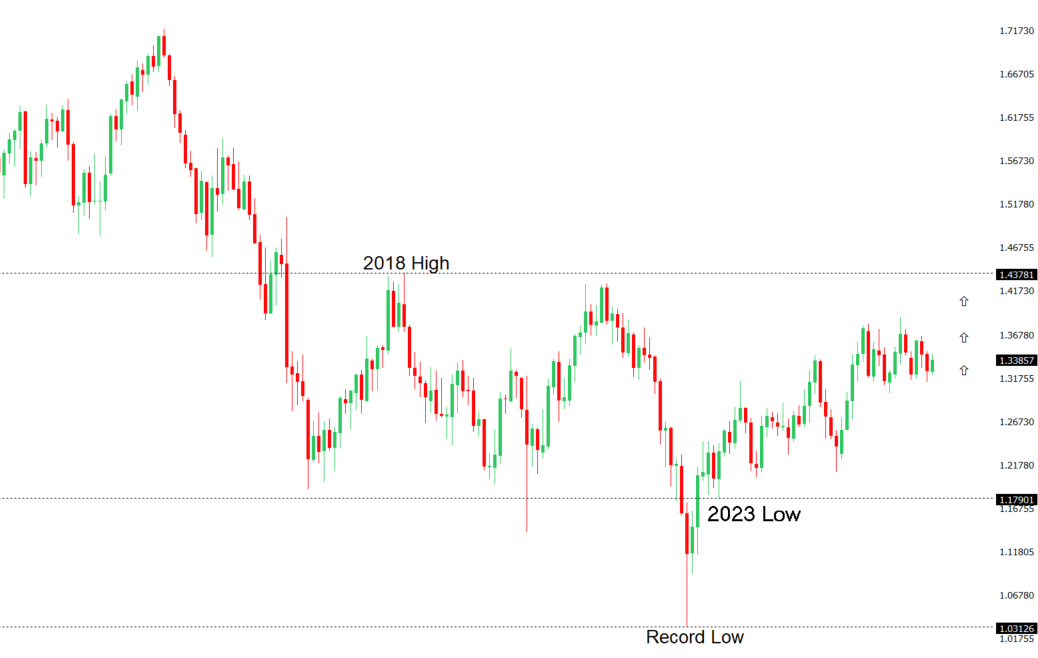 | ||
| R2 1.3461 - 15 June high - Medium R1 1.3452 - 10 July high - Medium S1 1.3322 - 8 July low - Medium S2 1.3273 - 22 June high - Medium | ||
| GBPUSD: fundamental overview | ||
| The pound remains largely driven by external rather than domestic factors, with Sterling under pressure as a stronger US dollar benefits from safe-haven demand following the latest escalation in US-Iran tensions and renewed concerns over energy supply disruptions through the Strait of Hormuz. Higher oil prices have reinforced expectations that inflation could remain elevated, supporting a more hawkish Federal Reserve outlook and limiting upside in GBPUSD ahead of today’s key US CPI report and Fed communication. Domestically, political uncertainty has eased after Andy Burnham secured overwhelming Labour backing to become the UK’s next prime minister, although attention is already shifting toward the government’s economic agenda after business groups urged swift action to tackle the UK’s persistently high industrial energy costs, which they argue are weighing on investment. Meanwhile, the latest retail spending data painted a mixed picture, with consumer spending supported by warm weather and the World Cup but overall retail sales growth slowing from May, suggesting underlying demand remains soft despite temporary boosts. Expectations that the Bank of England will maintain a restrictive policy stance continue to provide some support for Sterling, but with UK data taking a back seat, the pound remains primarily at the mercy of US dollar dynamics and evolving global risk sentiment. | ||
| USDJPY: technical overview | ||
| The major pair has extended its run to fresh multi-decade highs, with the latest push through 160.00 opening the door for further upside towards 165.00-170.00. At the same time, daily studies are looking quite stretched, suggesting we could see a healthy correction on the horizon. A break back below 160.48 would now strengthen the case for a larger pullback. Until then, the market will continue to be focused on additional gains. | ||
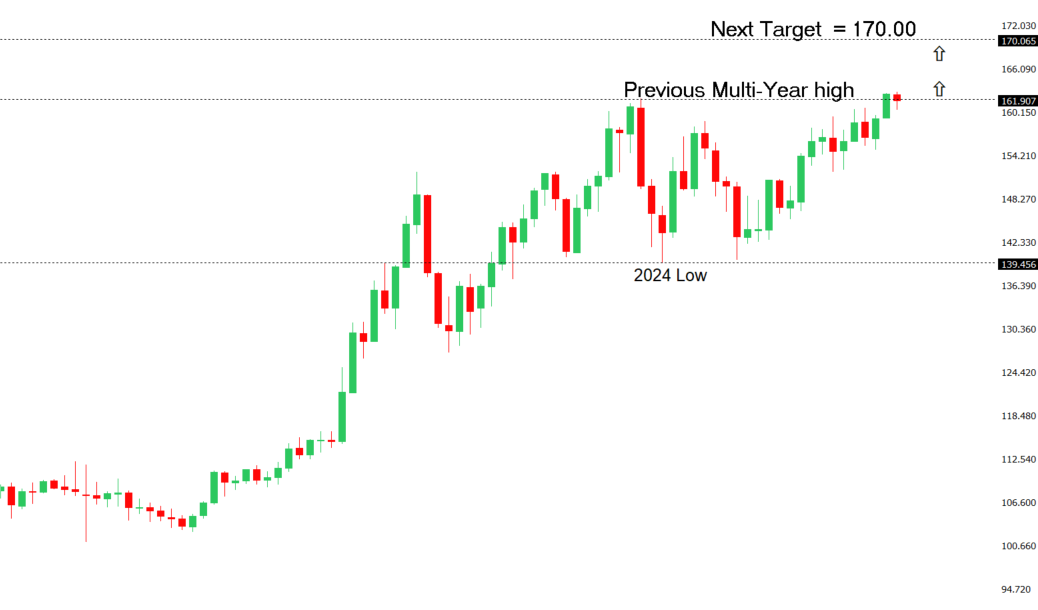 | ||
| R2 163.00 - Figure - Medium R1 162.84 - Multi-Year high/1 July 2026 - Strong S1 161.28 - 10 July low - Medium S2 160.48 - 3 July low - Medium | ||
| USDJPY: fundamental overview | ||
| The Yen remains under pressure as the wide interest rate differential with the United States continues to favor the US Dollar, while renewed tensions between the US and Iran have pushed oil prices higher, worsening Japan’s terms of trade given its heavy reliance on imported energy. The resulting increase in safe-haven demand for the US Dollar, alongside expectations that elevated energy prices could keep global inflation sticky and reinforce the case for a more restrictive Federal Reserve, has further weighed on the Yen. At the same time, the Bank of Japan continues to normalize policy only gradually, leaving Japan’s yield disadvantage firmly intact despite ongoing official rhetoric around fiscal discipline and market stability. With USDJPY still trading near multi-decade highs, speculation over potential Japanese currency intervention remains elevated, although previous interventions have had only a temporary impact without a broader shift in monetary policy or narrowing of the US-Japan rate differential. Looking ahead, today’s US CPI report and Fed Chair Kevin Warsh’s testimony represent key catalysts, with stronger-than-expected inflation likely reinforcing the Dollar’s advantage over the Yen, while a softer outcome could encourage a modest corrective recovery in the Japanese currency. | ||
| AUDUSD: technical overview | ||
| There are signs of the formation of a longer-term base with the market recovering out from a meaningful longer-term support zone. The latest monthly close back above 0.7000 takes the big picture pressure off the downside and strengthens the case for a bottom, with the focus now on a push towards 0.8000. Setbacks should now be well supported ahead of 0.6700. | ||
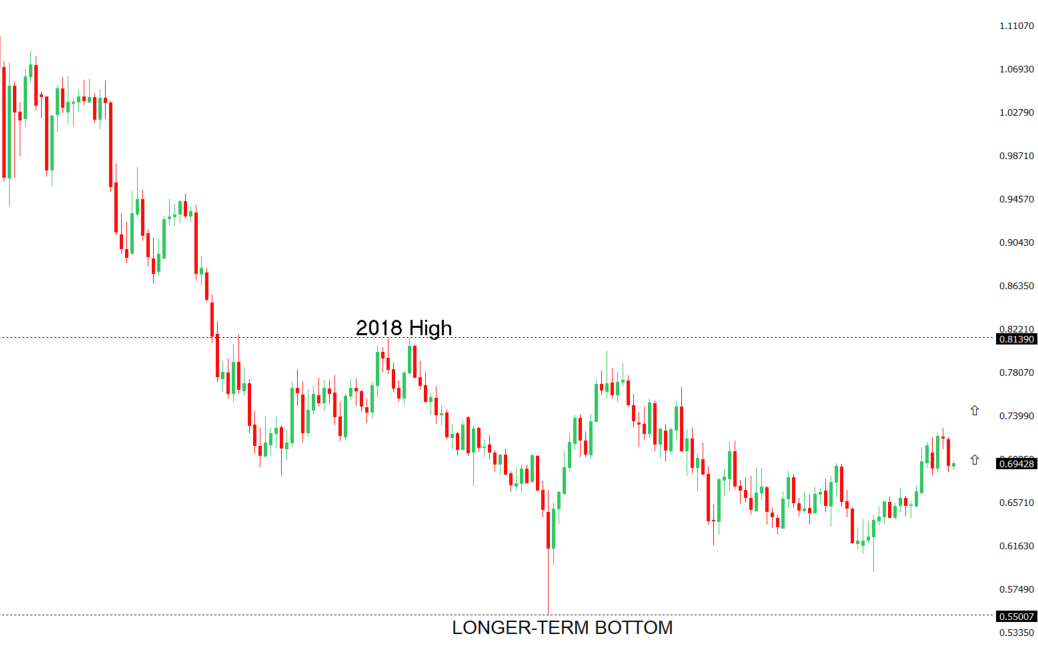 | ||
| R2 0.7089 - 15 June high - Strong R1 0.6970 - 10 July high - Medium S1 0.6865 - 30 June low - Medium S2 0.6833 - 30 March low - Strong | ||
| AUDUSD: fundamental overview | ||
| The Australian dollar remains primarily driven by external developments, with renewed US Dollar strength and a deterioration in global risk sentiment weighing on the currency as escalating US-Iran tensions boost demand for safe-haven assets and drive oil prices higher. The renewed disruption to shipping through the Strait of Hormuz has revived inflation concerns ahead of the US CPI report, reinforcing expectations that the Federal Reserve could maintain a restrictive policy stance and underpinning the greenback. Domestically, the backdrop remains relatively supportive. The RBA continues to signal that further tightening cannot be ruled out if inflation proves persistent, while resilient labor market conditions, improving business activity and still-elevated underlying inflation argue for rates remaining restrictive. The latest NAB survey showed business confidence improving and conditions holding steady, with easing price pressures and the first decline in retail prices in seven years, although those figures largely reflected a short-lived period of lower fuel costs before the latest Middle East escalation. As oil prices climb again, those softer inflation signals are already looking dated and are unlikely to materially alter the RBA’s cautious stance. Meanwhile, China’s economy continues to stabilize rather than accelerate, offering neither a meaningful tailwind nor a significant drag for Australia. As a result, the Aussie remains largely at the mercy of US Dollar direction, global risk sentiment and geopolitical developments, with upcoming US inflation data and Fed Chair Kevin Warsh’s testimony expected to be the key near-term catalysts. | ||
| Suggested reading | ||
| How the U.S. Stock Market Is Becoming Too Big to Fail, J. Adinolfi, Marketwatch (July 11, 2026) The Most Important Chart In Investing Wins Yet Again, S. McBride, RiskHedge (July 10, 2026) | ||