


 | ||
| 13th July 2026 | view in browser | ||
| Markets caught between missiles and macro | ||
| Markets begin the week balancing a renewed escalation in the US-Iran conflict and rising oil prices against a pivotal week of US inflation data and Fed Chair Kevin Warsh’s testimony, with investors assessing whether geopolitical risks or monetary policy will prove the dominant driver of global markets. | ||
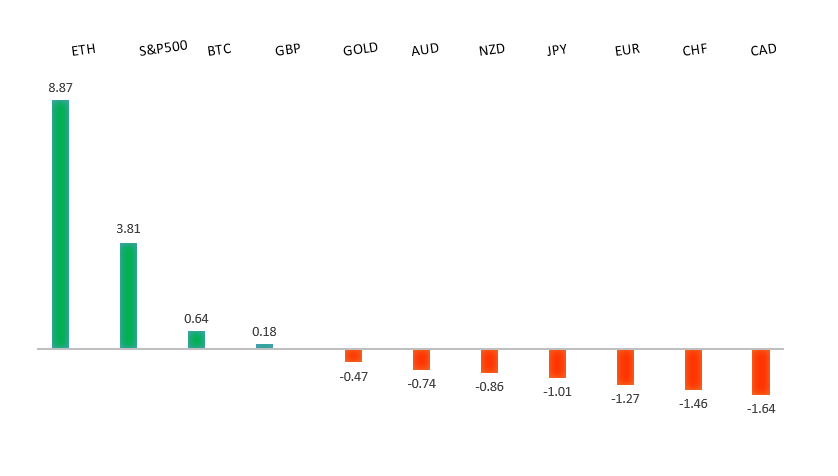
| Performance chart 30day v. USD (%) | ||
 | ||
| Technical & fundamental highlights | ||
| EURUSD: technical overview | ||
| The Euro outlook remains constructive with higher lows sought out on dips in favor of the next major upside extension targeting the 2021 high at 1.2350. Setbacks should be exceptionally well supported ahead of 1.1300. | ||
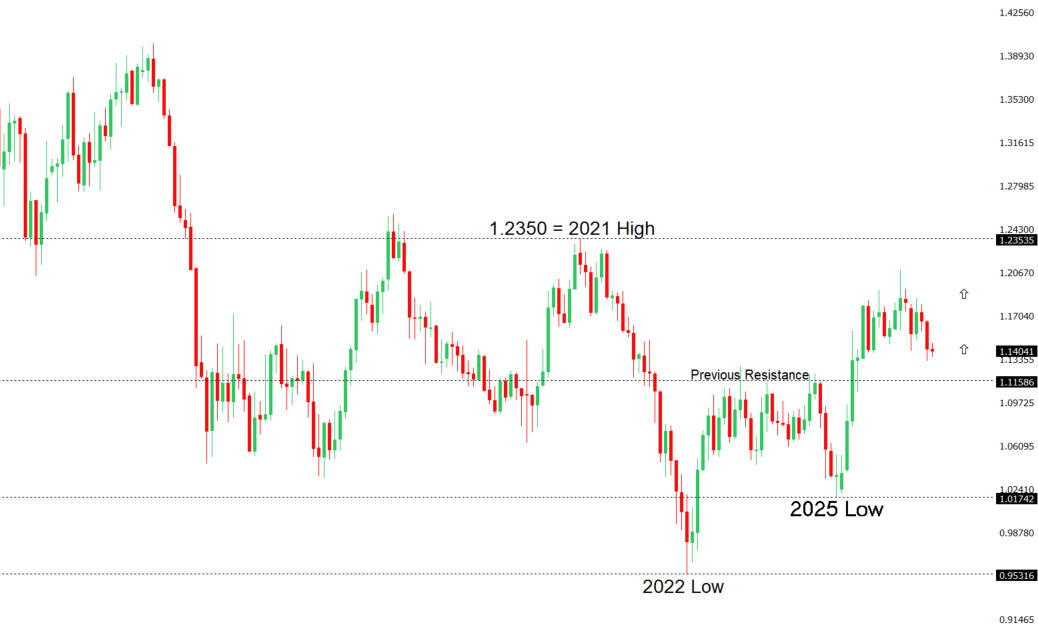 | ||
| R2 1.1529 - 18 June high - Medium R1 1.1473 - 2 July high - Medium S1 1.1325 - 24 June/2026 low - Medium S2 1.1300 - Figure - Medium | ||
| EURUSD: fundamental overview | ||
| The euro is consolidating as a softer US dollar continues to provide support following the recent weaker US employment report and a Federal Reserve minutes that highlighted significant uncertainty over the policy outlook, even as many officials still see the possibility of further tightening if inflation proves persistent. At the same time, the single currency’s upside is being tempered by easing Eurozone inflation pressures, with softer German and French CPI readings reinforcing expectations that the European Central Bank is nearing the end of its tightening cycle and reducing the urgency for additional rate hikes. Meanwhile, renewed geopolitical tensions between the US and Iran, including fresh military strikes and retaliatory threats, are underpinning safe-haven demand for the dollar and limiting broader euro gains, leaving EURUSD largely caught between a softer dollar backdrop and fading ECB policy support. | ||
| GBPUSD: technical overview | ||
| The Pound remains exceptionally well supported on dips into the 1.3000 area, with the price largely consolidating above the psychological barrier and previous resistance turned support in the form of the 2023 high. Look for the market to continue be well supported on dips ahead of the next major upside extension through the yearly high at 1.3870 and towards a retest of the 2018 high at 1.4377 further up. Only a monthly close below 1.3000 negates. | ||
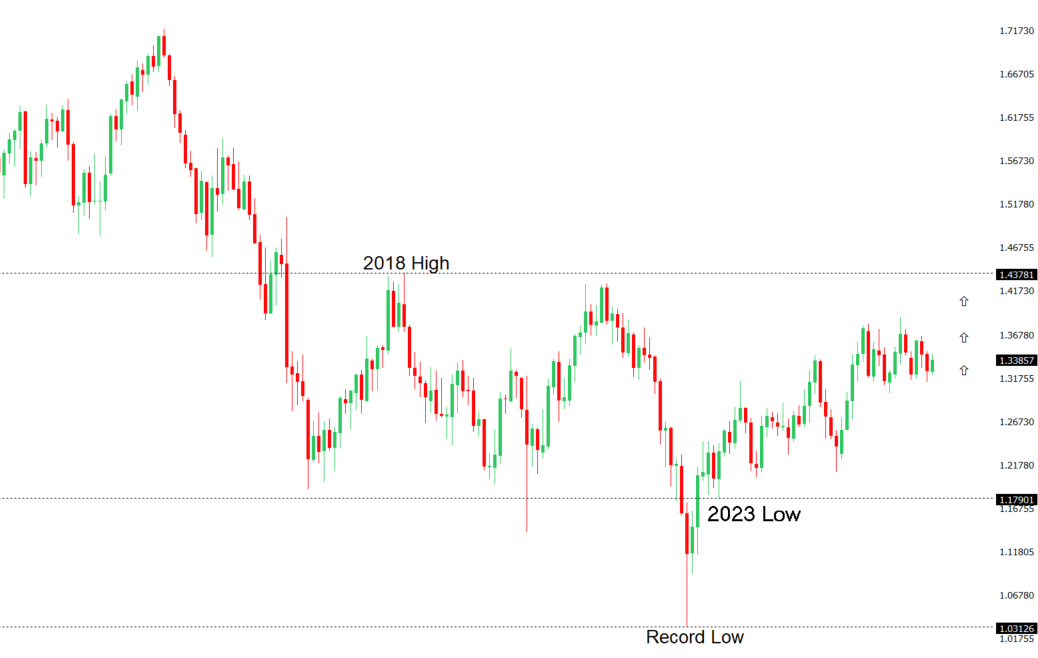 | ||
| R2 1.3461 - 15 June high - Medium R1 1.3452 - 10 July high - Medium S1 1.3322 - 8 July low - Medium S2 1.3273 - 22 June high - Medium | ||
| GBPUSD: fundamental overview | ||
| Sterling has remained relatively well supported by easing domestic political uncertainty, resilient UK fundamentals and a softer US dollar backdrop. Markets have largely welcomed the transition to incoming Prime Minister Andy Burnham, viewing the reduction in political uncertainty as supportive for UK assets, while an IMF upgrade to the UK’s growth outlook has reinforced confidence in the economy. Investors are also continuing to price a relatively hawkish Bank of England compared with many of its major peers as inflation remains elevated. Attention is now beginning to shift toward Burnham’s first fiscal agenda, with reports suggesting he is considering an expansive combined autumn budget and spending review that could include higher defense spending, new tax measures and broader structural reforms. While such plans could provide greater clarity on the government’s long-term economic strategy, they also introduce uncertainty around future borrowing requirements and fiscal discipline, leaving gilt markets and sterling sensitive to further details. Externally, the pound has also drawn support from reduced expectations for additional near-term Federal Reserve tightening following the latest FOMC minutes, although renewed volatility surrounding the US-Iran conflict and periodic safe-haven demand for the US dollar have continued to cap sterling’s upside. | ||
| USDJPY: technical overview | ||
| The major pair has extended its run to fresh multi-decade highs, with the latest push through 160.00 opening the door for further upside towards 165.00-170.00. At the same time, daily studies are looking quite stretched, suggesting we could see a healthy correction on the horizon. A break back below 160.48 would now strengthen the case for a larger pullback. Until then, the market will continue to be focused on additional gains. | ||
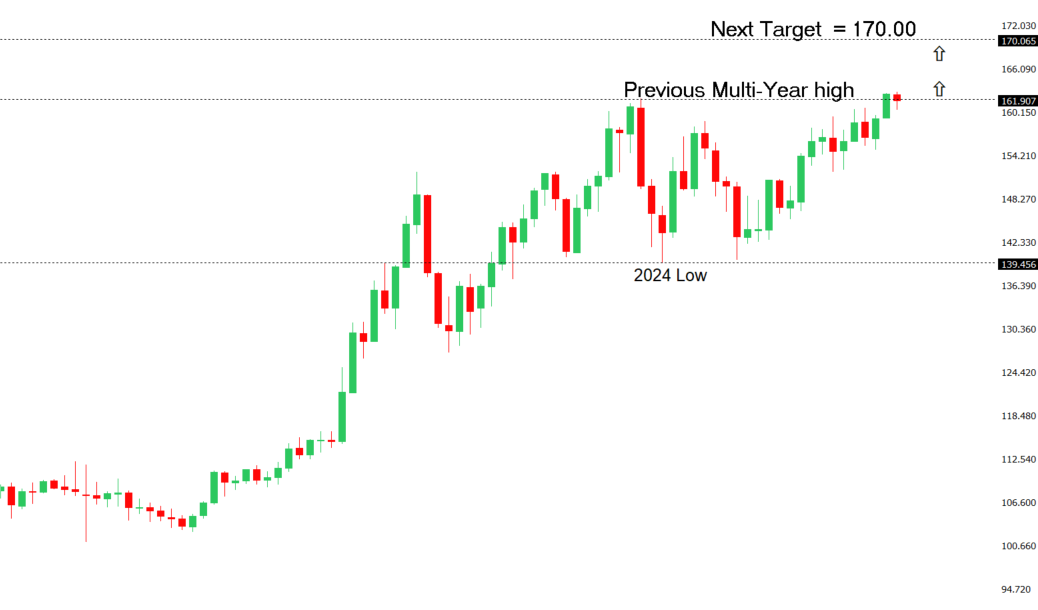 | ||
| R2 163.00 - Figure - Medium R1 162.84 - Multi-Year high/1 July 2026 - Strong S1 161.00 - Figure - Medium S2 160.48 - 3 July low - Medium | ||
| USDJPY: fundamental overview | ||
| The yen has found some demand in recent sessions after a series of domestic developments encouraged investors to trim heavily crowded short positions. Fresh support came from firmer-than-expected producer price data, government plans to encourage the Government Pension Investment Fund and households to increase allocations to domestic assets, and renewed fiscal reform commitments aimed at improving confidence in Japan’s public finances. Those announcements have reinforced expectations that the Bank of Japan will continue gradually normalizing policy while also fueling speculation that more capital could eventually be repatriated back into Japanese assets, though many analysts believe any meaningful shift will take time to materialize. At the same time, intervention risks remain elevated with USDJPY still trading at historically high levels despite the latest pullback, keeping traders cautious about maintaining aggressive bearish yen positions. That said, the currency continues to face important structural headwinds, including the still-wide US-Japan yield differential, the Bank of Japan’s cautious pace of policy tightening, and Japan’s vulnerability to higher oil prices as a major energy importer. Meanwhile, easing expectations for additional Federal Reserve tightening and a modest retreat in the US dollar have provided an additional near-term tailwind for the yen, even as ongoing uncertainty surrounding US-Iran tensions and the Strait of Hormuz continues to keep geopolitical risks firmly in focus. | ||
| AUDUSD: technical overview | ||
| There are signs of the formation of a longer-term base with the market recovering out from a meaningful longer-term support zone. The latest monthly close back above 0.7000 takes the big picture pressure off the downside and strengthens the case for a bottom, with the focus now on a push towards 0.8000. Setbacks should now be well supported ahead of 0.6700. | ||
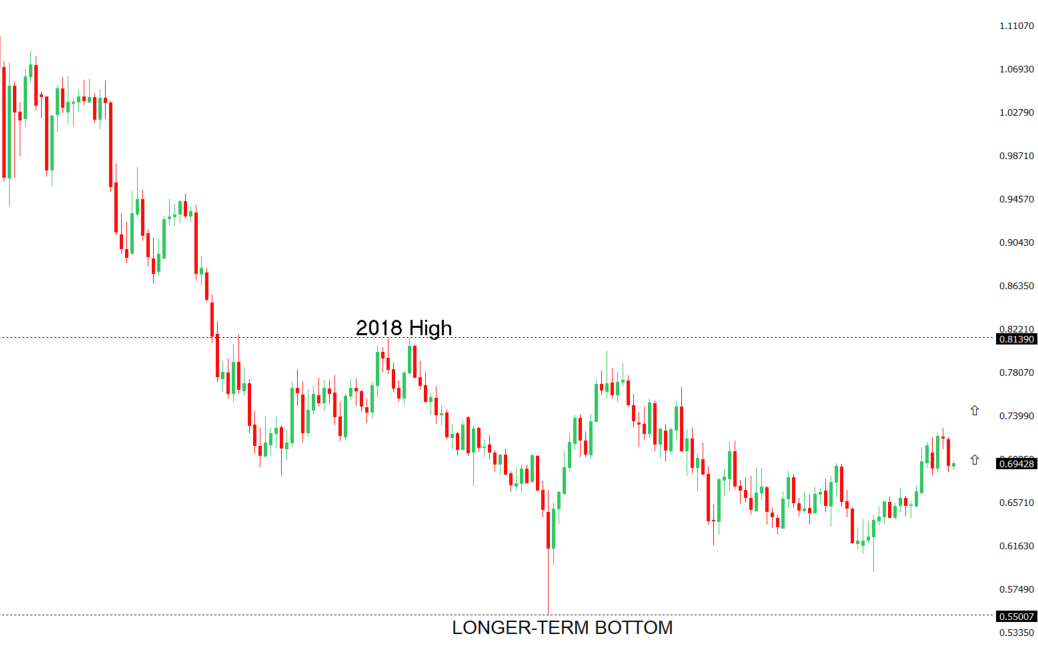 | ||
| R2 0.7089 - 15 June high - Strong R1 0.6979 - 11 June low - Medium S1 0.6865 - 30 June low - Medium S2 0.6833 - 30 March low - Strong | ||
| AUDUSD: fundamental overview | ||
| The Australian dollar has been underpinned by a softer US dollar, improved risk sentiment and renewed strength in the Chinese yuan, with the latter offering an additional tailwind given Australia’s deep trade links with China. Hopes that diplomatic efforts between the US and Iran could prevent a broader regional conflict have encouraged a modest recovery in risk-sensitive currencies, although lingering geopolitical tensions and the associated uncertainty around energy prices continue to limit upside momentum. On the domestic front, the Australian dollar has also found support from the Reserve Bank of Australia’s relatively hawkish tone after Assistant Governor Sarah Hunter indicated that persistently higher energy prices could warrant additional policy tightening if they threaten to keep inflation elevated. At the same time, expectations that the Federal Reserve could still deliver at least one more rate hike this year continue to support the US dollar and temper gains in AUDUSD. Looking ahead, markets will closely watch this week’s US CPI report and Australia’s consumer inflation expectations survey for fresh clues on the policy outlooks for both the Fed and the RBA. | ||
| Suggested reading | ||
| Kevin Warsh’s Quietude Is Bad For You and the Economy, C. Torres, Marketwatch (July 10, 2026) What The Momentum Trade Tells Us About The Market, M. Phillips, Axios (July 9, 2026) | ||