


 | ||
| 10th July 2026 | view in browser | ||
| Risk appetite regains the upper hand | ||
| Global markets begin the new day with risk appetite recovering as strong gains in US equities offset lingering Middle East tensions, leaving investors to balance resilient growth and AI optimism against persistent geopolitical risks and a still-cautious Federal Reserve outlook. | ||
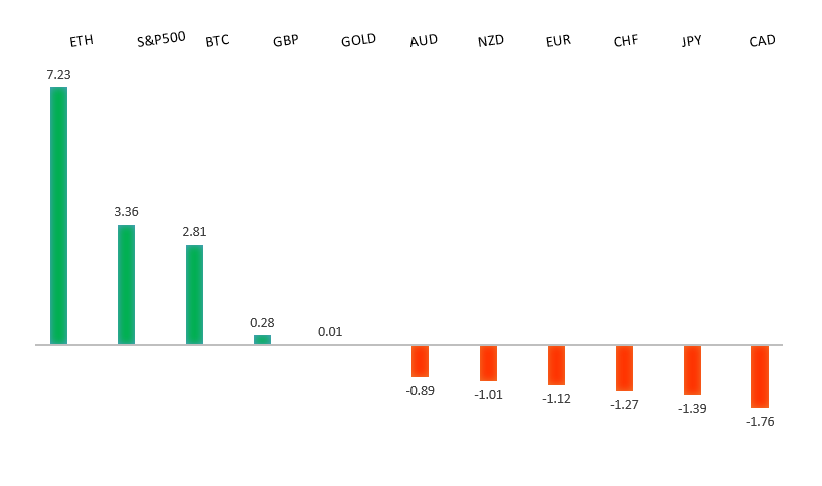
| Performance chart 30day v. USD (%) | ||
 | ||
| Technical & fundamental highlights | ||
| EURUSD: technical overview | ||
| The Euro outlook remains constructive with higher lows sought out on dips in favor of the next major upside extension targeting the 2021 high at 1.2350. Setbacks should be exceptionally well supported ahead of 1.1300. | ||
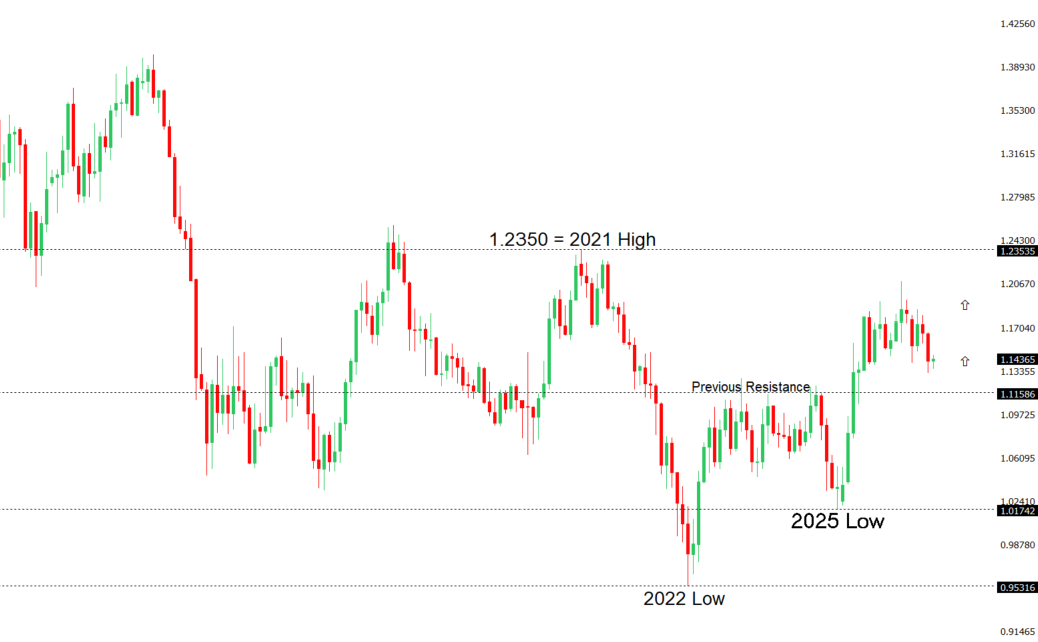 | ||
| R2 1.1529 - 18 June high - Medium R1 1.1473 - 2 July high - Medium S1 1.1325 - 24 June/2026 low - Medium S2 1.1300 - Figure - Medium | ||
| EURUSD: fundamental overview | ||
| The euro has found modest support as the US dollar eases back following last week’s softer US employment data and a Federal Reserve meeting that, while still signaling inflation concerns, highlighted considerable uncertainty over the policy outlook. Although markets continue to price a meaningful chance of another Fed rate hike later this year, expectations for an aggressive tightening cycle have softened, taking some momentum out of the dollar. At the same time, the euro has drawn support from a repricing of European Central Bank expectations, with markets once again leaning toward additional ECB tightening this year as higher energy prices and geopolitical risks threaten to complicate the inflation outlook, helping lift Eurozone bond yields relative to US Treasuries. Even so, gains in the single currency remain measured as softer recent Eurozone inflation data tempers the ECB’s tightening outlook, while renewed US-Iran tensions and the resulting safe-haven demand for the dollar continue to act as an important headwind for EURUSD. Investors are now looking to the ECB meeting accounts and incoming US economic data for fresh direction. | ||
| GBPUSD: technical overview | ||
| The Pound remains exceptionally well supported on dips into the 1.3000 area, with the price largely consolidating above the psychological barrier and previous resistance turned support in the form of the 2023 high. Look for the market to continue be well supported on dips ahead of the next major upside extension through the yearly high at 1.3870 and towards a retest of the 2018 high at 1.4377 further up. Only a monthly close below 1.3000 negates. | ||
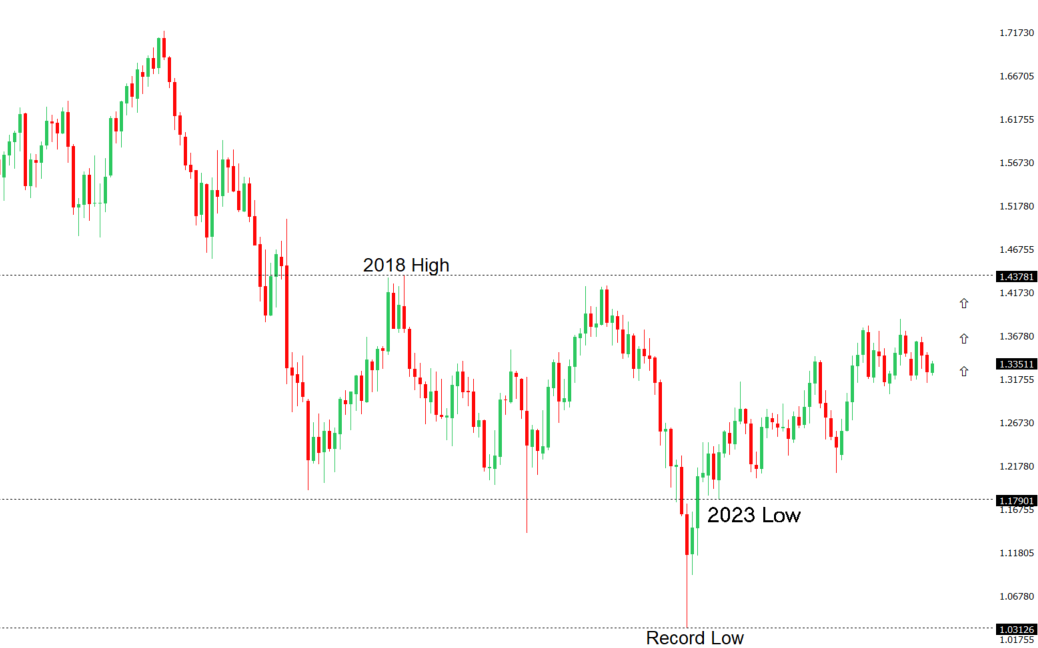 | ||
| R2 1.3461 - 15 June high - Medium R1 1.3431 - 9 July high - Medium S1 1.3262 - 2 July low - Medium S2 1.3212 - 30 June low - Medium | ||
| GBPUSD: fundamental overview | ||
| Sterling has been underpinned by a combination of easing domestic political uncertainty and resilient Bank of England rate expectations, although those gains have been tempered by renewed demand for the US Dollar on escalating Middle East tensions. With Andy Burnham widely expected to succeed Keir Starmer as Prime Minister later this month, markets have largely welcomed the prospect of a swift political transition, shifting their attention back toward the UK’s economic outlook and fiscal policy. At the same time, the BoE’s relatively hawkish stance, with policymakers continuing to express concern over sticky services inflation and markets still pricing in a reasonable chance of another rate hike before year-end, has helped support the pound. However, Cable’s upside has been constrained as fresh US strikes on Iran and the threat of further regional escalation have revived safe-haven demand for the Greenback. Meanwhile, the minutes from the Federal Reserve’s June meeting reinforced the view of a divided central bank, with policymakers split between keeping rates near current levels and tightening further should inflation remain persistent, leaving investors focused on incoming US inflation data for clearer direction on the Fed’s next move. | ||
| USDJPY: technical overview | ||
| The major pair has extended its run to fresh multi-decade highs, with the latest push through 160.00 opening the door for further upside towards 165.00-170.00. At the same time, daily studies are looking quite stretched, suggesting we could see a healthy correction on the horizon. A break back below 160.48 would now strengthen the case for a larger pullback. Until then, the market will continue to be focused on additional gains. | ||
 | ||
| R2 163.00 - Figure - Medium R1 162.84 - Multi-Year high/1 July 2026 - Strong S1 161.00 - Figure - Medium S2 160.48 - 3 July low - Medium | ||
| USDJPY: fundamental overview | ||
| The Yen remains under pressure as the wide interest rate differential between Japan and the United States continues to favor the US Dollar, even after USDJPY pulled back from fresh multi-decade highs above 163.00. While the Bank of Japan remains committed to gradually normalizing policy following its June rate hike, markets continue to see its tightening cycle lagging well behind the Federal Reserve, where expectations for further policy restraint remain elevated despite recent signs of softer US economic momentum. At the same time, renewed fighting between the US and Iran has driven oil prices higher, creating an additional headwind for the import-dependent Japanese economy by worsening its terms of trade and weighing on the Yen. Traders also remain highly alert to the risk of Japanese currency intervention, with USDJPY still trading well above the levels that previously prompted Tokyo to step into the market. Although officials have refrained from issuing stronger verbal warnings in recent days, the absence of rhetoric has done little to diminish speculation that authorities could intervene again if exchange rate moves become excessively volatile, particularly as next week’s US inflation data has the potential to reshape Fed expectations and narrow the yield advantage that has fueled the Dollar’s rally against the Yen. | ||
| AUDUSD: technical overview | ||
| There are signs of the formation of a longer-term base with the market recovering out from a meaningful longer-term support zone. The latest monthly close back above 0.7000 takes the big picture pressure off the downside and strengthens the case for a bottom, with the focus now on a push towards 0.8000. Setbacks should now be well supported ahead of 0.6700. | ||
 | ||
| R2 0.7089 - 15 June high - Strong R1 0.6979 - 11 June low - Medium S1 0.6865 - 30 June low - Medium S2 0.6833 - 30 March low - Strong | ||
| AUDUSD: fundamental overview | ||
| The Australian dollar is trading with a firmer tone, supported primarily by a softer US dollar and an improvement in broader risk appetite, although gains remain constrained by elevated geopolitical tensions in the Middle East. While the latest FOMC minutes reinforced the Federal Reserve’s concern over upside inflation risks and kept the prospect of further policy tightening alive, the greenback has struggled to capitalize, allowing the Aussie to recover. Domestically, expectations for additional Reserve Bank of Australia tightening have received fresh support after Assistant Governor Sarah Hunter reiterated that policymakers remain prepared to act if necessary to ensure inflation returns sustainably to target, despite recent moderation in monthly inflation readings. External developments in China also remain pivotal for the Australian dollar, with stronger-than-expected producer price inflation pointing to improving industrial pricing power, even as softer consumer inflation underscores lingering weakness in domestic demand, leaving the overall backdrop for Australia’s largest trading partner mixed. | ||
| Suggested reading | ||
| The shoemaker’s son behind Britain’s first financial crisis, J. Tett, Financial Times (July 9, 2026) Private Capital Is Taking AI Chips Off the Table, E. Luz, Morningstar (July 9, 2026) | ||