


Next 24 hours: About the recent trend at central banks
Today’s report: A case of positioning ahead of major event risk
What we’re seeing into Tuesday is a market that is more content on some consolidation than anything else. This would make sense as the new month gets underway and as cautious positioning kicks in ahead of tomorrow’s highly anticipated event risk in the form of the Fed decision.
Wake-up call
- import prices
- rate repricing
- negative rate
- RBA hikes
- downbeat poll
- RMB weakness
- Inflation headache
- Dealers report
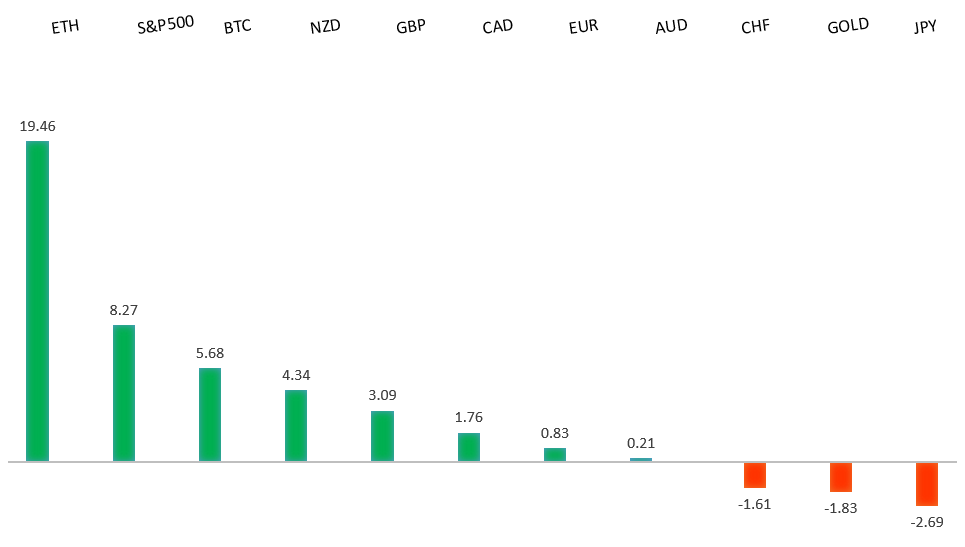
Peformance chart: 30 Day Performance vs. US dollar (%)
Suggested reading
- Lula Could Be a Good Friend to Brazil Investors, J. Authers, Bloomberg (November 1, 2022)
- Can Superhot Rock Energy Be Delivered at Scale?, M. McCormick, FT (October 31, 2022)
Chart talk: Technical & fundamental highlights
Choose pair:
EURUSD – technical overview
Technical studies are turning up from oversold territory, suggesting additional setbacks should be limited in favour of some form of a meaningful correction and consolidation. A weekly close back above parity will take the immediate pressure off the downside.EURUSD – fundamental overview
The Euro has been trading with a heavier tone since last week's dovish ECB communication. Making matters even more complicated has been a subsequent round of hotter than expected inflation data and barely positive growth readings. Key standouts on today’s calendar come from German import prices, US ISM manufacturing, US JOLTs job openings, and US construction spending.EURUSD - Technical charts in detail
GBPUSD – technical overview
Signs have emerged of the market wanting to put in a longer-term base after collapsing to a record low in September. A break above the September high at 1.1739 will solidify the recovery. Until then, look for setbacks to be well supported ahead of 1.0800.GBPUSD – fundamental overview
The Pound took a decent hit on Monday, struggling with UK business confidence at its lowest levels since March 2021, and a big dip in UK mortgage approvals. A 75 basis point rate hike from the BOE is no longer a done deal later this week, with the market now only pricing 65 basis points of hikes. Key standouts on today’s calendar come from German import prices, US ISM manufacturing, US JOLTs job openings, and US construction spending.USDJPY – technical overview
Technical studies are looking quite stretched on the longer-term chart, warning of consolidation and correction in the days and weeks ahead. Look for additional upside from here to be well capped on rallies above 150.00. Next key support comes in at 145.43.USDJPY – fundamental overview
The Yen has remained under pressure as the BOJ maintains its negative rate stance, while increasing JGB purchases. All of this comes at a time when inflation is surging. Japan believes it can counter inflation by way of a $200 billion stimulus plan. Key standouts on today’s calendar come from German import prices, US ISM manufacturing, US JOLTs job openings, and US construction spending.AUDUSD – technical overview
Overall pressure remains on the downside with the market confined to a well defined downtrend. A break back above 0.6682 would be required to take the pressure off the downside. Until then, scope exists for deeper setbacks towards 0.6000.AUDUSD – fundamental overview
Earlier today, the RBA was out hiking rates by 25 basis points as was widely expected. There weren't too many surprises from the accompanying communication either, with the central bank also showing a move back in the direction of being more worried about growth than inflation. Key standouts on today’s calendar come from German import prices, US ISM manufacturing, US JOLTs job openings, and US construction spending.USDCAD – technical overview
A recent surge back above 1.3000 signals an end to a period of bearish consolidation and suggests the market is in the process of carving out a more significant longer-term base. Next key resistance now comes in up into the 1.4000 area. Setbacks should be very well supported down into the 1.3000 area.USDCAD – fundamental overview
The Canadian Dollar has underperformed against its peers in recent trade, taking a hit on a pessimistic survey response. 47% of respondents reported weakening finances, while only 9% expect conditions to get better over the next 6 months. Key standouts on today’s calendar come from German import prices, US ISM manufacturing, US JOLTs job openings, and US construction spending.NZDUSD – technical overview
Overall pressure remains on the downside with the focus on a retest of the critical low from 2020 at 0.5469. A break back above 0.6162 would be required to take the immediate pressure off the downside.NZDUSD – fundamental overview
The New Zealand Dollar got some help from a hawkish shift in RBNZ Orr sentiment last week. At the same time, fallout in China and commodities prices, along with ongoing weakness in the RMB and Yen, have been enough to invite offers into this latest rally. New Zealand building permits data out earlier today came in as expected. Key standouts on today’s calendar come from German import prices, US ISM manufacturing, US JOLTs job openings, and US construction spending.US SPX 500 – technical overview
Longer-term technical studies are in the process of unwinding from extended readings off record highs. Look for rallies to be well capped in favor of lower tops and lower lows. Back above 4000 will be required at a minimum to take the immediate pressure off the downside. Next major support comes in around 3200.US SPX 500 – fundamental overview
We've finally reached a point in the cycle where the Fed recognizes unanchored inflation expectations pose a greater downside risk than over-tightening. This is significant, as it means less investor friendly monetary policy that risks potential recession in the months ahead. Overall, we expect inflation to continue to be a problem in 2022 that results in downside pressure into rallies.GOLD (SPOT) – technical overview
The 2019 breakout above the 2016 high at 1375 was a significant development, opening the door for fresh record highs. Setbacks should now be well supported above 1600 on a monthly close basis ahead of the next major upside extension.GOLD (SPOT) – fundamental overview
The yellow metal continues to be well supported on dips with solid demand from medium and longer-term accounts. These players are more concerned about inflation risk and a less upbeat global growth outlook. All of this should keep the commodity well supported, with many market participants also fleeing to the hard asset as the grand dichotomy of record high equities and record low yields comes to an unnerving climax.