


Next 24 hours: Euro gets a boost from first round French election result
Today’s report: A downgraded US GDP outlook, tariff fears, and the French election
The US Dollar comes into the new week mildly offered after a wave of USD negative drivers in the previous week. The Atlanta Fed’s downgraded growth outlook for the US economy definitely played its part, while the Buck also stumbled on cooler PCE readings and renewed tariff fears.
Wake-up call
- French election
- GDP beat
- intervention timing
- Rallying metals
- cut pricing
- USD outflows
- Fed outlook
- Macro themes
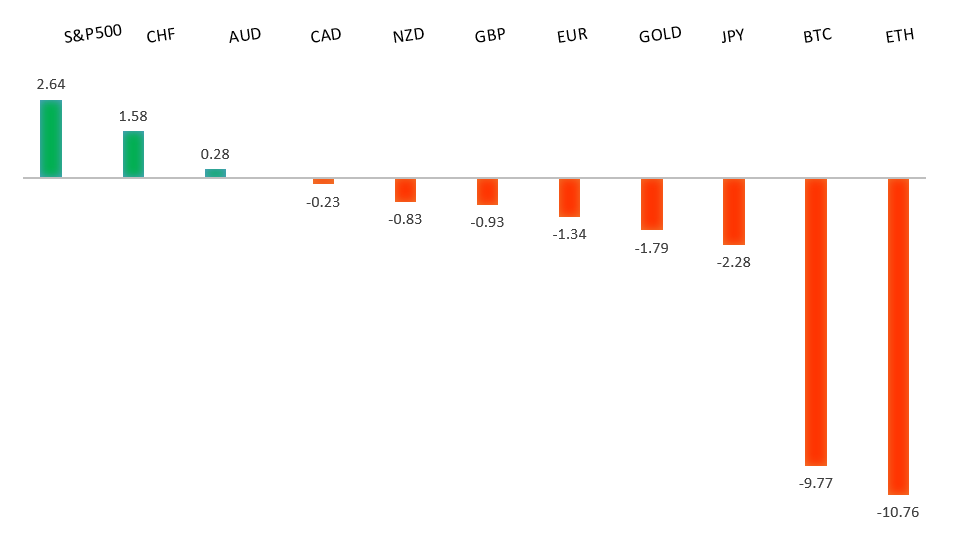
Peformance chart: 30-Day Performance vs. US dollar (%)
Suggested reading
- The Federal Reserve’s Little Secret, R. Karma, The Atlantic (June 27, 2024)
- Company Performance vs Stock Performance, L. Swedroe, Alpha Architect (June 28, 2024)
Chart talk: Technical & fundamental highlights
Choose pair:
EURUSD – technical overview
The Euro has been in a multi-month consolidation since bottoming out in 2022. Setbacks have since been exceptionally well supported on dips below 1.0500, with a higher platform sought out ahead of the next major upside extension. Look for a push through the 2023 high at 1.1276 to strengthen the constructive outlook and extend the recovery run towards 1.2000. Only back below 1.0400 negates.EURUSD – fundamental overview
German unemployment has ticked up, while French inflation data has cooled. Meanwhile, French bond yields have printed year-to-date highs as Macron sinks further in the polls. The Euro has however managed to find support despite all of this on the back of broad based US Dollar selling after the Atlanta Fed downwardly revised its growth outlook. We suspect in the sessions ahead, the Euro will get back to reacting and digesting updates from the French election. Key standouts on Monday’s calendar come from Japan consumer confidence, UK Nationwide house prices, German and Eurozone manufacturing PMIs, BOE consumer credit and UK mortgage approvals, UK manufacturing PMIs, German inflation, US ISM manufacturing, and US construction spending.EURUSD - Technical charts in detail
GBPUSD – technical overview
Signs have emerged of the market wanting to put in a longer-term base after collapsing to a record low in September 2022. The door is now open for the next major upside extension towards the 2023 high at 1.3143. Any setbacks should be well supported ahead of 1.2000.GBPUSD – fundamental overview
The Pound closed out the previous week on a strong note after taking in better than expected UK GDP data and an improvement in private consumption. Meanwhile, the Dollar was softer after the Atlanta Fed downgraded the growth outlook for the US economy. Key standouts on Monday’s calendar come from Japan consumer confidence, UK Nationwide house prices, German and Eurozone manufacturing PMIs, BOE consumer credit and UK mortgage approvals, UK manufacturing PMIs, German inflation, US ISM manufacturing, and US construction spending.USDJPY – technical overview
The market remains confined to a strong uptrend, most recently extending to a multi-year high through 160.00. Key support comes in at 151.95, with only a weekly close below to delay the constructive outlook. Next major resistance comes in at 165.00.USDJPY – fundamental overview
The Yen has extended its multi-year decline against the Buck as monetary policy divergence continues to weigh. At this point, there has been no official response from Japanese officials. It's possible USDJPY 165 is now the new level that is being watched. Key standouts on Monday’s calendar come from Japan consumer confidence, UK Nationwide house prices, German and Eurozone manufacturing PMIs, BOE consumer credit and UK mortgage approvals, UK manufacturing PMIs, German inflation, US ISM manufacturing, and US construction spending.AUDUSD – technical overview
There are signs of the potential formation of a longer-term base with the market trading down into a meaningful longer-term support zone. Only a monthly close below 0.6200 would give reason for rethink. Back above 0.6900 will take the big picture pressure off the downside and strengthen case for a bottom.AUDUSD – fundamental overview
The Australian Dollar put in a nice performance to close out the previous week, getting a boost from rallying metals prices and broad based selling in the US Dollar after the Atlanta Fed downgraded the growth outlook. Key standouts on Monday’s calendar come from Japan consumer confidence, UK Nationwide house prices, German and Eurozone manufacturing PMIs, BOE consumer credit and UK mortgage approvals, UK manufacturing PMIs, German inflation, US ISM manufacturing, and US construction spending.USDCAD – technical overview
Above 1.3000 signals an end to a period of longer-term bearish consolidation and suggests the market is in the process of carving out a more significant longer-term base. Next key resistance now comes in up into the 1.4000 area. Setbacks should be very well supported down into the 1.3000 area.USDCAD – fundamental overview
The market wasn't overly impressed with as expected Canada GDP data. Instead, the Canadian Dollar has been held up relative to its peers as OIS rates pricing sees a near 50% chance for a July Bank of Canada rate cut, up dramatically from 15% just days earlier. Key standouts on Monday’s calendar come from Japan consumer confidence, UK Nationwide house prices, German and Eurozone manufacturing PMIs, BOE consumer credit and UK mortgage approvals, UK manufacturing PMIs, German inflation, US ISM manufacturing, and US construction spending.NZDUSD – technical overview
Overall pressure remains on the downside with the market continuing to stall out on runs up into the 0.6500 area. At the same time, there are some signs of the market wanting to put in a longer-term base. Ultimately, a break back above 0.6500 would be required to take the medium-term pressure off the downside and encourage this prospect. A monthly close below 0.5800 will intensify bearish price action.NZDUSD – fundamental overview
The New Zealand Dollar has been thinking more about the possible impact of a Trump Presidency after last week's debate. US-China trade is back in the crosshairs and could be something that weighs on the risk correlated currency. But for now, the Kiwi rate has found some support on the back of broad based US Dollar selling after the Atlanta Fed downgraded the growth outlook for the US economy. Key standouts on Monday’s calendar come from Japan consumer confidence, UK Nationwide house prices, German and Eurozone manufacturing PMIs, BOE consumer credit and UK mortgage approvals, UK manufacturing PMIs, German inflation, US ISM manufacturing, and US construction spending.US SPX 500 – technical overview
Longer-term technical studies continue to look quite extended, begging for a deeper correction ahead. At the same time, the latest bullish breakout to a fresh record high beyond the 2024 high opens the door for the next measured move upside extension targeting the 5650 area. Key support comes in at 5194.US SPX 500 – fundamental overview
Though we have seen a healthy adjustment of investor expectations towards the amount of rate cuts in 2024, the market still hopes policy will end up erring more towards the investor friendly, accommodative side of things. This bet has kept stocks well bid into dips and consistently pushing record highs. Still, if there is a sense the Fed will need to be more sensitive towards erring on the side of higher rates, it could invite major disruption to the stock market.GOLD (SPOT) – technical overview
The 2019 breakout above the 2016 high at 1375 was a significant development, opening the door for fresh record highs and this next major upside extension into the 2500-3000 area. Setbacks should now be well supported above 2000 on a monthly close basis.GOLD (SPOT) – fundamental overview
The yellow metal has pushed record highs in 2024 with solid demand from medium and longer-term accounts. These players are more concerned about inflation, geopolitical risk and a less upbeat global growth outlook. All of this should keep the commodity well supported, with many market participants also fleeing to the hard asset as the grand dichotomy of record high equities and record low yields comes to an end.