


Today’s report: Friday calendar stacked with first-tier data
The decline in the Yen has been one of the biggest stories of the week. The currency now sits at a 38-year low against the US Dollar. This weakness has many wondering when Japanese officials will finally intervene. Key standouts on Friday’s calendar come from German import prices, UK GDP, German unemployment, Canada GDP, US core PCE, personal income, personal spending, Michigan sentiment, Chicago PMIs, and Fed speak.
Wake-up call
- French election
- UK GDP
- intervention timing
- China, Japan
- cut odds
- bigger picture
- Fed outlook
- Macro themes
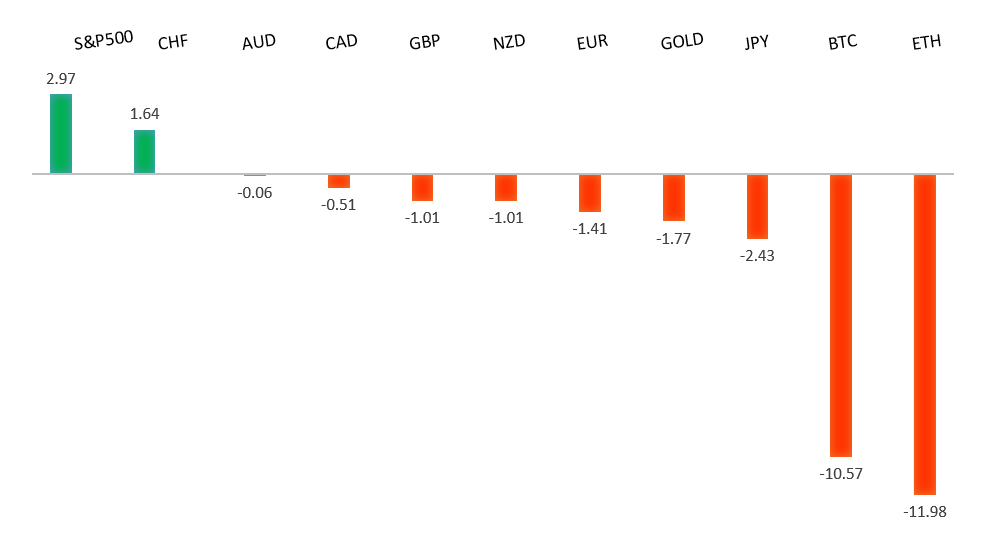
Peformance chart: 30-Day Performance vs. US dollar (%)
Suggested reading
- Chinese brokers launder hundreds of millions, J. Sinclair, Financial Times (June 26, 2024)
- Market Breadth Reveals It's Not All About Nvidia, Fisher Investments (June 26, 2024)
Chart talk: Technical & fundamental highlights
Choose pair:
EURUSD – technical overview
The Euro has been in a multi-month consolidation since bottoming out in 2022. Setbacks have since been exceptionally well supported on dips below 1.0500, with a higher platform sought out ahead of the next major upside extension. Look for a push through the 2023 high at 1.1276 to strengthen the constructive outlook and extend the recovery run towards 1.2000. Only back below 1.0400 negates.EURUSD – fundamental overview
The Euro got a boost on Thursday from the broad selling pressure on the US Dollar. At the same time, gains were well capped with traders still nervous about taking on too much Euro exposure into the weekend French election risk. Meanwhile, ECB Kazaks was on the wires saying rate cuts would come faster if pay growth wasn't so strong. Key standouts on Friday’s calendar come from German import prices, UK GDP, German unemployment, Canada GDP, US core PCE, personal income, personal spending, Michigan sentiment, Chicago PMIs, and Fed speak.EURUSD - Technical charts in detail
GBPUSD – technical overview
Signs have emerged of the market wanting to put in a longer-term base after collapsing to a record low in September 2022. The door is now open for the next major upside extension towards the 2023 high at 1.3143. Any setbacks should be well supported ahead of 1.2000.GBPUSD – fundamental overview
Absence of economic data out of the UK on Thursday left the Pound trading on bigger picture flow which leaned slightly in the UK currency's favor. Key standouts on Friday’s calendar come from German import prices, UK GDP, German unemployment, Canada GDP, US core PCE, personal income, personal spending, Michigan sentiment, Chicago PMIs, and Fed speak.USDJPY – technical overview
The market remains confined to a strong uptrend, most recently extending to a multi-year high through 160.00. Key support comes in at 151.95, with only a weekly close below to delay the constructive outlook. Next major resistance comes in at 165.00.USDJPY – fundamental overview
The Yen has extended its multi-year decline against the Buck as monetary policy divergence continues to weigh. At this point, there has been no official response from Japanese officials. It's possible USDJPY 165 is now the new level that is being watched. Key standouts on Friday’s calendar come from German import prices, UK GDP, German unemployment, Canada GDP, US core PCE, personal income, personal spending, Michigan sentiment, Chicago PMIs, and Fed speak.AUDUSD – technical overview
There are signs of the potential formation of a longer-term base with the market trading down into a meaningful longer-term support zone. Only a monthly close below 0.6200 would give reason for rethink. Back above 0.6900 will take the big picture pressure off the downside and strengthen case for a bottom.AUDUSD – fundamental overview
The Australian Dollar wasn't able to do much with rising Aussie consumer inflation expectations and a local market that is now pricing 17 basis point of higher rates before the end of the year. It seems the currency is more concerned about economic slowdown in China and Japan. Key standouts on Friday’s calendar come from German import prices, UK GDP, German unemployment, Canada GDP, US core PCE, personal income, personal spending, Michigan sentiment, Chicago PMIs, and Fed speak.USDCAD – technical overview
Above 1.3000 signals an end to a period of longer-term bearish consolidation and suggests the market is in the process of carving out a more significant longer-term base. Next key resistance now comes in up into the 1.4000 area. Setbacks should be very well supported down into the 1.3000 area.USDCAD – fundamental overview
A weak Canada April payrolls number didn't do anything to help the Canadian Dollar. Odds for a July Bank of Canada rate cut have jumped to about 40%, double what the odds were earlier in the week. Key standouts on Friday’s calendar come from German import prices, UK GDP, German unemployment, Canada GDP, US core PCE, personal income, personal spending, Michigan sentiment, Chicago PMIs, and Fed speak.NZDUSD – technical overview
Overall pressure remains on the downside with the market continuing to stall out on runs up into the 0.6500 area. At the same time, there are some signs of the market wanting to put in a longer-term base. Ultimately, a break back above 0.6500 would be required to take the medium-term pressure off the downside and encourage this prospect. A monthly close below 0.5800 will intensify bearish price action.NZDUSD – fundamental overview
The New Zealand Dollar hasn't been moving much in recent sessions. Absence of first-tier data has left the currency focused on bigger picture themes and with US equities not doing much, the Kiwi rate has been confined to some tighter trading ranges. Key standouts on Friday’s calendar come from German import prices, UK GDP, German unemployment, Canada GDP, US core PCE, personal income, personal spending, Michigan sentiment, Chicago PMIs, and Fed speak.US SPX 500 – technical overview
Longer-term technical studies continue to look quite extended, begging for a deeper correction ahead. At the same time, the latest bullish breakout to a fresh record high beyond the 2024 high opens the door for the next measured move upside extension targeting the 5650 area. Key support comes in at 5194.US SPX 500 – fundamental overview
Though we have seen a healthy adjustment of investor expectations towards the amount of rate cuts in 2024, the market still hopes policy will end up erring more towards the investor friendly, accommodative side of things. This bet has kept stocks well bid into dips and consistently pushing record highs. Still, if there is a sense the Fed will need to be more sensitive towards erring on the side of higher rates, it could invite major disruption to the stock market.GOLD (SPOT) – technical overview
The 2019 breakout above the 2016 high at 1375 was a significant development, opening the door for fresh record highs and this next major upside extension into the 2500-3000 area. Setbacks should now be well supported above 2000 on a monthly close basis.GOLD (SPOT) – fundamental overview
The yellow metal has pushed record highs in 2024 with solid demand from medium and longer-term accounts. These players are more concerned about inflation, geopolitical risk and a less upbeat global growth outlook. All of this should keep the commodity well supported, with many market participants also fleeing to the hard asset as the grand dichotomy of record high equities and record low yields comes to an end.