


Next 24 hours: Euro slips, Pound outperforms
Today’s report: A tale of two economies
Financial markets are looking at quite a contrast between developments in the US and abroad. Economic data out of the US has been strong relative to what has otherwise been softer data and updates in the global economy.
Wake-up call
- ECB approach
- BOE hold
- BOJ decision
- trade war
- consumer confidence
- China outlook
- political outlook
- Macro themes
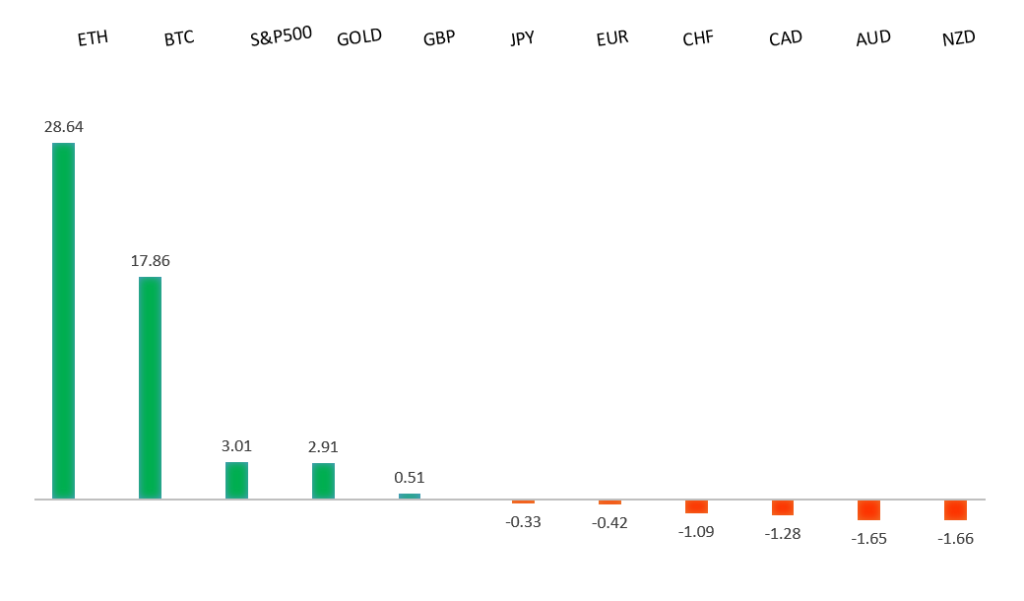
Peformance chart: 30-Day Performance vs. US dollar (%)
Suggested reading
- Rate Cut Focus Is Proving Overrated … in Charts!, Fisher Investments (December 12, 2024)
- Market Prices Are A Very Unreliable Way To Detect Inflation, J. Tamny, Forbes (December 15, 2024)
Chart talk: Technical & fundamental highlights
Choose pair:
EURUSD – technical overview
The Euro has been in a multi-month consolidation since bottoming out in 2022. Setbacks have since been exceptionally well supported on dips below 1.0500, with a higher platform sought out ahead of the next major upside extension. Look for a major bounce in the days ahead and the start to a push back towards the 2023 high at 1.1276. Only a monthly close below 1.0400 negates.EURUSD – fundamental overview
The Euro has been having a hard time catching a bid in light of recent comments from ECB President Lagarde. Lagarde was out highlighting the fact that the central bank's earlier approach, which aimed to maintain restrictive rates 'for as long as necessary' is no longer aligned with the ECB’s evolving outlook for inflation and risk balance. Key standouts on Tuesday’s calendar come from UK employment data, German Ifo reads, Eurozone trade, German and Eurozone ZEW reads, Canada inflation and housing data, US retail sales, US industrial production, US business inventories, US NAHB housing, and the New Zealand GDT auction.EURUSD - Technical charts in detail
GBPUSD – technical overview
Signs have emerged of the market wanting to put in a longer-term base after collapsing to a record low in September 2022. The door is now open for the next major upside extension towards the 2018 high at 1.4377. Setbacks should be well supported above 1.2500 on a monthly close basis.GBPUSD – fundamental overview
While the BOE may lean a little more dovish with its communication later this week, the central bank is still expected to hold on rates. This should keep the Pound supported, especially a time when the ECB and Fed are continuing to cut rates. Key standouts on Tuesday’s calendar come from UK employment data, German Ifo reads, Eurozone trade, German and Eurozone ZEW reads, Canada inflation and housing data, US retail sales, US industrial production, US business inventories, US NAHB housing, and the New Zealand GDT auction.USDJPY – technical overview
The market is looking to resume the longer-term uptrend after an intense correction in 2024. A higher low is ideally sought out above 140.00 in favor of a bullish continuation. The recent weekly close back above 150.00 strengthens the case for longer-term uptrend resumption.USDJPY – fundamental overview
The Yen is now trading cautiously ahead of this week's Fed and BOJ risk. Recent economic data has been more supportive of the idea of the BOJ moving ahead with another hike, though lingering uncertainties around wage growth and inflation may be enough to keep the central bank for doing anything just yet. Key standouts on Tuesday’s calendar come from UK employment data, German Ifo reads, Eurozone trade, German and Eurozone ZEW reads, Canada inflation and housing data, US retail sales, US industrial production, US business inventories, US NAHB housing, and the New Zealand GDT auction.AUDUSD – technical overview
There are signs of the potential formation of a longer-term base with the market trading down into a meaningful longer-term support zone. Only a monthly close below 0.6200 would give reason for rethink. A monthly close back above 0.7000 will take the big picture pressure off the downside and strengthen case for a bottom.AUDUSD – fundamental overview
The Australian Dollar has grown more sensitive to the prospect of a US trade war with China. RBA Deputy Governor Hauser said Australia would be more seriously affected by the global trade war because it relied on China for a large percentage of its exports.Key standouts on Tuesday’s calendar come from UK employment data, German Ifo reads, Eurozone trade, German and Eurozone ZEW reads, Canada inflation and housing data, US retail sales, US industrial production, US business inventories, US NAHB housing, and the New Zealand GDT auction.USDCAD – technical overview
A sustained hold above 1.3000 over the past several months signals an end to a period of longer-term bearish consolidation and suggests the market is in the process of carving out a more significant longer-term base. Next key resistance now comes in up into the 1.4500-1.5000 area, exposing a retest of the 2020 high just ahead of 1.4700. Setbacks should be very well supported ahead of 1.3500.USDCAD – fundamental overview
The Canadian Dollar continues to slide to multi-month lows amidst a weaker economic outlook and political drama. We've seen a number of cabinet resignations in recent days coupled with consumer confidence plummeting to a new year-to-date low. Key standouts on Tuesday’s calendar come from UK employment data, German Ifo reads, Eurozone trade, German and Eurozone ZEW reads, Canada inflation and housing data, US retail sales, US industrial production, US business inventories, US NAHB housing, and the New Zealand GDT auction.NZDUSD – technical overview
Overall pressure remains on the downside with the market continuing to stall out on runs up into the 0.6500 area. At the same time, there are some signs of the market wanting to put in a longer-term base. Ultimately, a break back above 0.6500 would be required to take the medium-term pressure off the downside and encourage this prospect. A monthly close below 0.5800 will intensify bearish price action.NZDUSD – fundamental overview
The New Zealand Dollar is already contending with the prospect for another 50 basis point rate cut from the RBNZ as per Governor Orr comments. Adding insult to injury is the outlook for China at a time where trade wars with the US may make things all the more challenging. Meanwhile, a recent poll of US based CEOs shows confidence in China turning pessimistic for the first time since the pandemic. Key standouts on Tuesday’s calendar come from UK employment data, German Ifo reads, Eurozone trade, German and Eurozone ZEW reads, Canada inflation and housing data, US retail sales, US industrial production, US business inventories, US NAHB housing, and the New Zealand GDT auction.US SPX 500 – technical overview
The longer term uptrend remains intact and dips continue to be exceptionally well supported. Critical support comes in at 5679, with only a break back below this level to compromise the structure and open the door for a more significant corrective decline. Until then, the focus remains on a continued push to fresh record highs.US SPX 500 – fundamental overview
The US equities market remains exceptionally well supported in 2024 on the back of an ongoing expectation for more rate cuts than less going forward. Investors are feeling better about a soft landing in the US economy and this has also been accompanied by an accommodative adjustment of Fed policy. Moreover, there has been a fresh wave of market optimism in the aftermath of the Trump election victory. It will however be important to keep an eye on inflation, bigger picture economic data, and geopolitical risk in the weeks and months ahead.GOLD (SPOT) – technical overview
The 2019 breakout above the 2016 high at 1375 was a significant development, opening the door for fresh record highs and this next major upside extension into the 3000 area. Setbacks should now be well supported above 2500 on a monthly close basis.GOLD (SPOT) – fundamental overview
The yellow metal has pushed record highs in 2024 with solid demand from medium and longer-term accounts. These players are more concerned about inflation, geopolitical risk and a less upbeat global growth outlook. All of this should keep the commodity well supported over the coming months.