


Next 24 hours: Will the Fed bend to the will of the market?
Today’s report: About central banks and recent trends
We had been seeing a trend in 2022 of central banks raising rates by more than expected. But all of a sudden, this trend has been compromised after the BOE recently went 25 basis points instead of 50 and the RBA just did the same.
Wake-up call
- Nordstream
- government U-Turn
- still weak
- RBA surprises
- commodities boost
- RBNZ outlook
- Inflation headache
- Dealers report
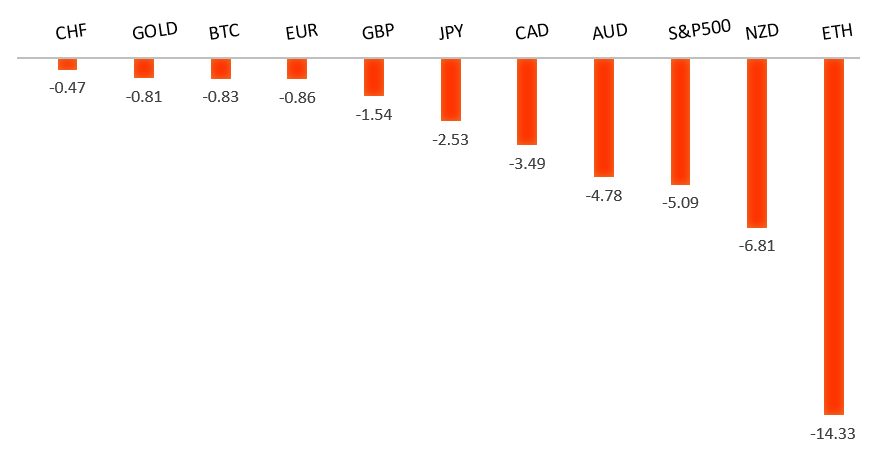
Peformance chart: 30 Day Performance vs. US dollar (%)
Suggested reading
- When Kim Kardashian and Liz Truss Get Caught Out, J. Authers, Bloomberg (October 4, 2022)
- Strategic Moves that Transformed AC Milan’s Fortunes, J. Fontanella-Khan, FT (October 4, 2022)
Chart talk: Technical & fundamental highlights
Choose pair:
EURUSD – technical overview
The market has come under intense pressure in recent months, with setbacks accelerating below parity. The next major support level comes in the form of the psychological barrier at 0.9000. At the same time, technical studies are turning up from oversold territory, suggesting additional setbacks should be limited in favour of some form of a meaningful base. Back above parity will take the immediate pressure off the downside.EURUSD – fundamental overview
The Euro didn't get as much love on Monday, despite a wave of risk on flow and broad based selling in the US Dollar. Nordstream and Ukraine concerns were behind the less enthusiastic price action. Meanwhile, a round of Eurozone PMI reads were all revised lower. Key standouts on today’s calendar come from Eurozone producer prices, US JOLTs job openings, US factory orders, and a round of Fed speak.EURUSD - Technical charts in detail
GBPUSD – technical overview
Signs have emerged of the market wanting to put in a longer-term base after collapsing to a record low in September. A break above the September high at 1.1739 will solidify the recovery. Until then, look for setbacks to be well supported ahead of 1.0800.GBPUSD – fundamental overview
The UK government eliminated a proposed policy to cut taxes on top earners, and the Pound was seen outperforming on Monday as a consequence. This lowered the price tag on the tax-cut bill dramatically from GBP45 billion to GBP2 billion. Key standouts on today’s calendar come from Eurozone producer prices, US JOLTs job openings, US factory orders, and a round of Fed speak.USDJPY – technical overview
Technical studies are looking quite stretched on the longer-term chart, warning of consolidation and correction in the days and weeks ahead. Look for additional upside from here to be well capped into the 145.00 area. Next key support comes in at 140.35.USDJPY – fundamental overview
The Yen sits just off multi-year low levels and back around pre-intervention levels from September, despite the BOJ's aggressive attempts to force a reversal of flow last month. Key standouts on today’s calendar come from Eurozone producer prices, US JOLTs job openings, US factory orders, and a round of Fed speak.AUDUSD – technical overview
Overall pressure remains on the downside with the market confined to a well defined downtrend. A break back above 0.6682 would be required to take the pressure off the downside. Until then, scope exists for deeper setbacks towards 0.6000.AUDUSD – fundamental overview
The Australian Dollar had already been lagging on softness in the Australian housing market, before coming under more pressure today after the RBA only opted to raise rates by 25 basis points, contrary to expectations for a 50 basis point hike. Key standouts on today’s calendar come from Eurozone producer prices, US JOLTs job openings, US factory orders, and a round of Fed speak.USDCAD – technical overview
A recent surge back above 1.3000 signals an end to a period of bearish consolidation and suggests the market is in the process of carving out a more significant longer-term base. Next key resistance now comes in up into the 1.4000 area. Setbacks should be very well supported down into the 1.3000 area.USDCAD – fundamental overview
The Canadian Dollar got a boost on Monday from risk on flow, broad selling of the US Dollar and a recovery in commodities prices. Key standouts on today’s calendar come from Eurozone producer prices, US JOLTs job openings, US factory orders, and a round of Fed speak.NZDUSD – technical overview
Overall pressure remains on the downside with the focus on a retest of the critical low from 2020 at 0.5469. A break back above 0.5755 would be required to take the immediate pressure off the downside.NZDUSD – fundamental overview
The New Zealand Dollar managed to recover a little on Monday as risk appetite improved and the US Dollar sold off. However, we are seeing some selling on spillover from the RBA decision where the central bank surprised with a smaller rate hike. This has fueled speculation the RBNZ will also go smaller when it meets tomorrow. Key standouts on today’s calendar come from Eurozone producer prices, US JOLTs job openings, US factory orders, and a round of Fed speak.US SPX 500 – technical overview
Longer-term technical studies are in the process of unwinding from extended readings off record highs. Look for rallies to be well capped in favor of lower tops and lower lows. Back above 3922 will be required at a minimum to take the immediate pressure off the downside. Next major support comes in around 3200.US SPX 500 – fundamental overview
We've finally reached a point in the cycle where the Fed recognizes unanchored inflation expectations pose a greater downside risk than over-tightening. This is significant, as it means less investor friendly monetary policy that risks potential recession in the months ahead. Overall, we expect inflation to continue to be a problem in 2022 that results in downside pressure into rallies.GOLD (SPOT) – technical overview
The 2019 breakout above the 2016 high at 1375 was a significant development, opening the door for fresh record highs. Setbacks should now be well supported above 1600 on a monthly close basis ahead of the next major upside extension.GOLD (SPOT) – fundamental overview
The yellow metal continues to be well supported on dips with solid demand from medium and longer-term accounts. These players are more concerned about inflation risk and a less upbeat global growth outlook. All of this should keep the commodity well supported, with many market participants also fleeing to the hard asset as the grand dichotomy of record high equities and record low yields comes to an unnerving climax.