


Today’s report: About war, inflation and diverging central bank policy
The ongoing Russia-Ukraine war has been a headline story, but surging commodities and record inflation is also happening and is also a major focus for financial markets.
Wake-up call
- Euro inflation
- BOE pricing
- No direction
- impressive GDP
- oil reverses
- economic data
- Stocks vulnerable
- Dealers report
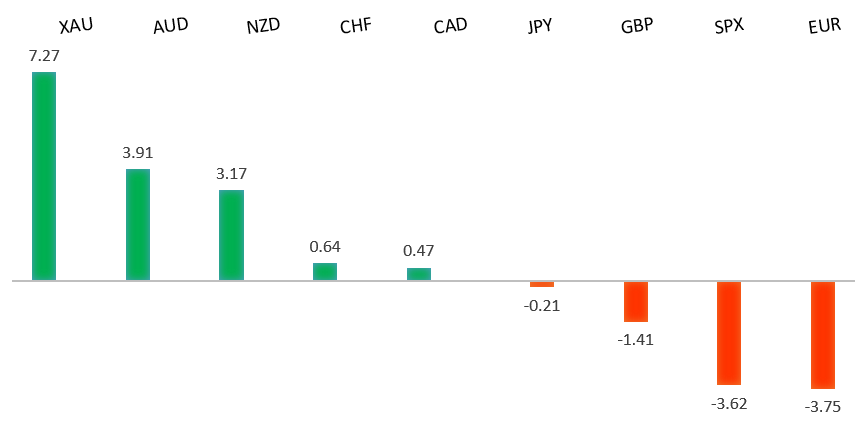
Peformance chart: 30 Day Performance vs. US dollar (%)
Suggested reading
- We Already Have a Solution for Oil’s Price Shock, D. Fickling, Bloomberg (March 4, 2022)
- Raspberry Pi - the tiny British computer turns 10, T. Hannen, Financial Times (March 4, 2022)
Chart talk: Technical & fundamental highlights
Choose pair:
EURUSD – technical overview
The latest breakdown below 1.1100 to fresh multi-month lows now sets up the next major downside extension below 1.1000 towards the multi-year low from 2020 in the 1.0600 area.EURUSD – fundamental overview
The Euro is in an increasingly difficult spot, with the currency under a lot of pressure as the Russia-Ukraine crisis compromises growth prospects and the ECB is forced to hold off on responding to record high inflation risk as a consequence. Rising gas prices are making it very hard to see Europe avoid an energy shock recession. The latest Eurozone inflation data has produced record setting numbers. Key standouts on today’s calendar come from German trade, Eurozone construction PMIs, UK construction PMIs, Eurozone retail sales, Canada Ivey PMIs, and the US jobs report.EURUSD - Technical charts in detail
GBPUSD – technical overview
The market is in a correction phase in the aftermath of the run to fresh multi-month highs in 2021. At this stage, additional setbacks should be limited to the 1.3000 area ahead of the next major upside extension towards a retest and break of critical resistance in the form of the 2018 high. Back above 1.3835 takes pressure off the downside.GBPUSD – fundamental overview
The Pound has seen some relative outperformance in recent sessions given the benefit of the UK being more distanced from Russia-Ukraine fallout. We've also seen the currency hold up well in the aftermath of solid housing data, an upward revision to manufacturing PMI reads and hawkish BOE expectations. Key standouts on today’s calendar come from German trade, Eurozone construction PMIs, UK construction PMIs, Eurozone retail sales, Canada Ivey PMIs, and the US jobs report.USDJPY – technical overview
The longer-term trend is bearish despite the recent run higher. Look for additional upside to be limited, with scope for a topside failure and bearish resumption back down towards the 100.00 area. It would take a clear break back above 117.00 to negate the outlook.USDJPY – fundamental overview
There hasn't been much to focus on here other than traditional market drivers of US Dollar sentiment and global risk appetite. The net result has been a currency mostly trading sideways. Key standouts on today’s calendar come from German trade, Eurozone construction PMIs, UK construction PMIs, Eurozone retail sales, Canada Ivey PMIs, and the US jobs report.AUDUSD – technical overview
The Australian Dollar has been in the process of a healthy correction following the impressive run towards a retest of the 2018 high in 2021. At this stage, the market has found a bottom and has entered a period of consolidation. It will take a break back above 0.7600 to shift the focus back on the topside. A weekly close below 0.7000 will force a bearish shift.AUDUSD – fundamental overview
The Australian Dollar continues to benefit from rallying commodities prices and solid local data. On Thursday, Aussie GDP was impressive, coming in well above forecast. The market hasn't paid much attention to the latest record monthly drop in building approvals. Key standouts on today’s calendar come from German trade, Eurozone construction PMIs, UK construction PMIs, Eurozone retail sales, Canada Ivey PMIs, and the US jobs report.USDCAD – technical overview
Finally signs of a major bottom in the works after a severe decline from the 2020 high. A recent weekly close back above 1.2500 encourages the constructive outlook and opens the door for a push back towards next critical resistance in the 1.3000 area. Any setbacks should be well supported into the 1.2200s.USDCAD – fundamental overview
The Canadian Dollar has come under pressure since earlier this week when it was rallying on a hawkish Bank of Canada and surging oil. We've since seen selling from risk off flow and a price correction in the oil market. Key standouts on today’s calendar come from German trade, Eurozone construction PMIs, UK construction PMIs, Eurozone retail sales, Canada Ivey PMIs, and the US jobs report.NZDUSD – technical overview
Setbacks have intensified in recent weeks with the market trading down to fresh multi-month lows. A recent breakdown below the 0.6700 area opens the door for a drop towards 0.6500 in the sessions ahead.NZDUSD – fundamental overview
The New Zealand Dollar has benefitted from the surge in commodities prices, but as lagged relative to its Aussie cousin this week after New Zealand business confidence, home price data and building permits all took a turn for the worse. Key standouts on today’s calendar come from German trade, Eurozone construction PMIs, UK construction PMIs, Eurozone retail sales, Canada Ivey PMIs, and the US jobs report.US SPX 500 – technical overview
Longer-term technical studies are in the process of unwinding from extended readings off record highs. The latest breakdown below 4,272 opens the door for the next major downside extension towards 3,500. Back above 4,612 will be required at a minimum to take the immediate pressure off the downside.US SPX 500 – fundamental overview
With so little room for additional central bank accommodation, given an already depressed interest rate environment, the prospect for sustainable runs to the topside on easy money policy incentives and government stimulus, should no longer be as enticing to investors. Meanwhile, ongoing worry associated with coronavirus fallout, rising inflation, and geopolitical tension should weigh more heavily on investor sentiment in Q1 2022.GOLD (SPOT) – technical overview
The 2019 breakout above the 2016 high at 1375 was a significant development, opening the door for fresh record highs and an acceleration beyond the next major psychological barrier at 2000. Setbacks should now be well supported above 1700.GOLD (SPOT) – fundamental overview
The yellow metal continues to be well supported on dips with solid demand from medium and longer-term accounts. These players are more concerned about exhausted monetary policy, extended global equities, coronavirus fallout, and geopolitical tension. All of this should keep the commodity well supported, with many market participants also fleeing to the hard asset as the grand dichotomy of record high equities and record low yields comes to an unnerving climax.