


Today’s report: All quiet into the heart of the US holiday
We’re into a very quiet period for financial markets as the summer gets going and US markets are out celebrating a long weekend holiday.
Wake-up call
- ECB Nagel
- holiday trade
- policy divergence
- hike odds
- Commodities rally
- building permits
- Inflation headache
- Dealers report
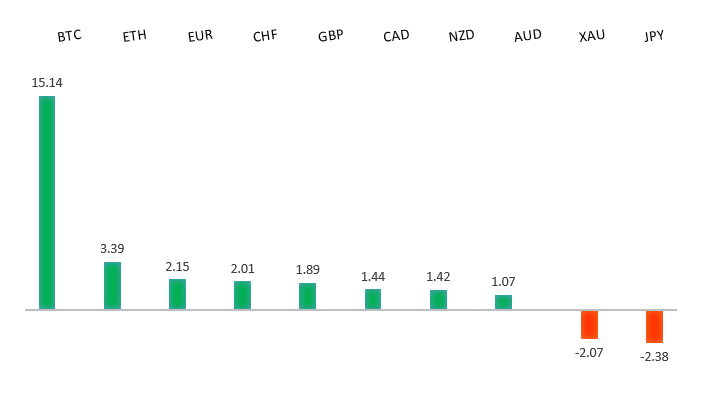
Peformance chart: 30 Day Performance vs. US dollar (%)
Suggested reading
- The Latest Eulogy for Corporate Profits Is Premature, J. Levin, Bloomberg (July 3, 2023)
- Nobody Knows Anything, 2023 First Half Edition, B. Ritholtz, The Big Picture (June 30, 2023)
Chart talk: Technical & fundamental highlights
Choose pair:
EURUSD – technical overview
The Euro remains well supported on dips following a run to the topside through 1.1000 earlier this year. Any additional setbacks should be well supported ahead of 1.0500 in favor of the formation of the next major higher low and a bullish continuation. Ultimately, only a monthly close back below 1.0500 would give reason for concern. Next key resistance comes in the form of the March 2022 high at 1.1185.EURUSD – fundamental overview
The Euro continues to hold up well on dips as hawkish ECB rhetoric keeps up. ECB Nagel is the latest official on the wires saying upside risks to inflation remain and the rate hike campaign has a ways to go. Key standouts on Tuesday’s calendar come from the RBA decision, German trade, Canada manufacturing PMIs, and the New Zealand GDT auction. The market will be exceptionally thin on account of the July 4th US holiday closure.EURUSD - Technical charts in detail
GBPUSD – technical overview
Signs have emerged of the market wanting to put in a longer-term base after collapsing to a record low in September 2022. The November 2022 monthly close back above 1.2000 strengthens this prospect. Any setbacks should now be well supported ahead of 1.2000. Next key resistance comes in at 1.3000.GBPUSD – fundamental overview
The Pound has been in the process of consolidating in some very thin summer holiday trade. Key standouts on Tuesday’s calendar come from the RBA decision, German trade, Canada manufacturing PMIs, and the New Zealand GDT auction. The market will be exceptionally thin on account of the July 4th US holiday closure.USDJPY – technical overview
The major pair has seen a nice recovery following the massive correction out from multi-year highs. Setbacks have finally been well supported ahead of 125.00 in the 127s thus far. At this stage, it looks like the market could be wanting to resume the bigger picture uptrend and head back towards a retest of that multi-year high from October 2022 up at 151.95. Look for any weakness to continue to be well supported in favor of higher lows along the way.USDJPY – fundamental overview
Higher JGB yields and a stronger Tankan report haven't really had much impact on the Yen, with the currency remaining under pressure near yearly lows against the Buck. Yield differentials and monetary policy divergence themes continue to lean hard in the US Dollar's favor. Key standouts on Tuesday’s calendar come from the RBA decision, German trade, Canada manufacturing PMIs, and the New Zealand GDT auction. The market will be exceptionally thin on account of the July 4th US holiday closure.AUDUSD – technical overview
There are signs of the potential formation of a longer-term base following the late 2022 surge back above 0.6500. Next key resistance comes in at 0.7284. Setbacks should continue to be well supported in the 0.6500 area. Only a monthly close below 0.6500 would give reason for rethink.AUDUSD – fundamental overview
Aussie rate hike bets have faded in recent sessions which has weighed on the Australian Dollar. Market odds for a hike later today have dipped to around 20%. Key standouts on Tuesday’s calendar come from the RBA decision, German trade, Canada manufacturing PMIs, and the New Zealand GDT auction. The market will be exceptionally thin on account of the July 4th US holiday closure.USDCAD – technical overview
Above 1.3000 signals an end to a period of longer-term bearish consolidation and suggests the market is in the process of carving out a more significant longer-term base. Next key resistance now comes in up into the 1.4000 area. Setbacks should be very well supported down into the 1.3000 area.USDCAD – fundamental overview
The Canadian Dollar has steadied in recent session on account of higher commodities prices and well supported equities. Key standouts on Tuesday’s calendar come from the RBA decision, German trade, Canada manufacturing PMIs, and the New Zealand GDT auction. The market will be exceptionally thin on account of the July 4th US holiday closure.NZDUSD – technical overview
Overall pressure remains on the downside with the market once again stalling out on a run up into the 0.6500 area. Ultimately, a break back above 0.6577 would be required to take the immediate pressure off the downside. A monthly close below 0.6000 would intensify bearish price action.NZDUSD – fundamental overview
Most of this latest impressive recovery in the price of the New Zealand Dollar comes from upbeat global risk sentiment and higher equities. We've also seen some demand from less bad New Zealand building permits. Key standouts on Tuesday’s calendar come from the RBA decision, German trade, Canada manufacturing PMIs, and the New Zealand GDT auction. The market will be exceptionally thin on account of the July 4th US holiday closure.US SPX 500 – technical overview
Longer-term technical studies are in the process of unwinding from extended readings off record highs. Look for rallies to be well capped in favor of lower tops and lower lows. A monthly close back above 4400 will be required to take the immediate pressure off the downside. Next key support comes in at 4260.US SPX 500 – fundamental overview
We've finally reached a point in the cycle where the Fed recognizes unanchored inflation expectations pose a greater downside risk than over-tightening. This is significant, as it means less investor friendly monetary policy that risks potential recession in the months ahead. Overall, we expect inflation to continue to be a problem in 2023 that results in downside pressure into rallies despite market expectations that would argue otherwise.GOLD (SPOT) – technical overview
The 2019 breakout above the 2016 high at 1375 was a significant development, opening the door for fresh record highs. Setbacks should now be well supported above 1600 on a monthly close basis ahead of the next major upside extension. The recent break back above 1808 strengthens the bullish outlook. Next major resistance comes in at 2100, above which opens the next extension towards 2,500.GOLD (SPOT) – fundamental overview
The yellow metal continues to be well supported on dips with solid demand from medium and longer-term accounts. These players are more concerned about inflation risk and a less upbeat global growth outlook. All of this should keep the commodity well supported, with many market participants also fleeing to the hard asset as the grand dichotomy of record high equities and record low yields comes to an unnerving climax.