


Next 24 hours: Back to selling the USD and buying stocks
Today’s report: Back to pushing for a Fed pivot
Overall, economic data out of the US has taken a shift to the more downbeat side. This includes moderating wages data as per last Friday’s jobs report, and a weak services survey as well.
Wake-up call
- core inflation
- GBPUSD GBP strength defies logic
- Hawkish Yamaguchi
- China reopening
- jobs report
- housing data
- Inflation headache
- Dealers report
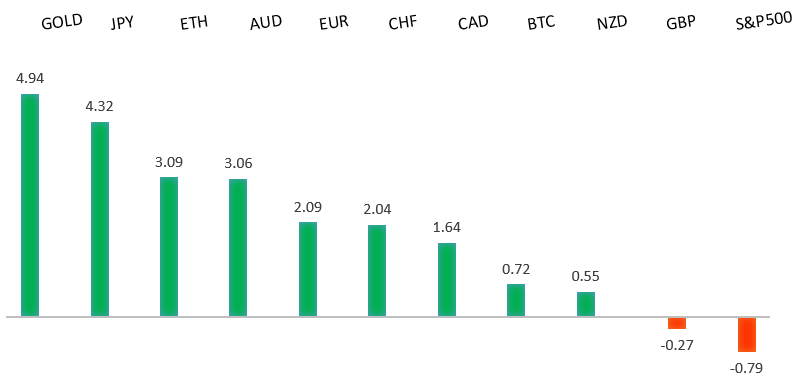
Peformance chart: 30 Day Performance vs. US dollar (%)
Suggested reading
- Europe’s Coming Bond Avalanche Will Test the ECB, M. Ashworth, Bloomberg (January 6, 2023)
- China's Unfolding Equity Bull Market, L. Gave, Evergreen Gavekal (January 6, 2023)
Chart talk: Technical & fundamental highlights
Choose pair:
EURUSD – technical overview
The Euro recovery has finally run back above meaningful previous support turned resistance at 1.0635. The December close above this level further encourages the recovery outlook and makes a stronger case for the formation of a longer-term bottom. Any setbacks should now be well supported ahead of 1.0200.EURUSD – fundamental overview
Eurozone core inflation printed a record high on Friday, helping to fuel the latest topside run in the single currency. Key standouts on Monday’s calendar come from German industrial production, Eurozone unemployment, Canada building permits, and US consumer inflation expectations.EURUSD - Technical charts in detail
GBPUSD – technical overview
Signs have emerged of the market wanting to put in a longer-term base after collapsing to a record low in September. The latest weekly close back above the September high at 1.1739 strengthens this prospect. Any setbacks should now be well supported ahead of 1.1100. Next key resistance comes in at 1.2668.GBPUSD – fundamental overview
The Pound comes into the new week on a strong note, after closing out the previous week with a bang. The performance was a bit of a head scratcher and hard to reconcile, especially with UK construction PMI reads dipping into contractionary territory. Key standouts on Monday’s calendar come from German industrial production, Eurozone unemployment, Canada building permits, and US consumer inflation expectations.USDJPY – technical overview
Longer-term technical studies are in the process of unwinding from severe overbought readings. Look for additional corrective price action back down towards the 126.00 area before the market considers the possibility of uptrend resumption. Rallies should now be well capped ahead of 140.00.USDJPY – fundamental overview
The JGB market has come under pressure as a new high in the core rate is seen at 3.8%. Meanwhile the benchmark 10-year yield has breached the 0.50% cap. Perhaps also adding to some recent Yen demand is the expectation of hawkish Yamaguchi being favored to replace Kuroda. Key standouts on Monday’s calendar come from German industrial production, Eurozone unemployment, Canada building permits, and US consumer inflation expectations.AUDUSD – technical overview
There are signs of the potential formation of a longer-term base following the recent surge back above 0.6500. The recent weekly close back above previous support now turned resistance at 0.6682 strengthens the outlook for a bullish structural shift.AUDUSD – fundamental overview
The China reopening and restart of coal exports to China are major drivers behind this latest wave of strength in the Australian Dollar. Key standouts on Monday’s calendar come from German industrial production, Eurozone unemployment, Canada building permits, and US consumer inflation expectations.USDCAD – technical overview
A recent surge back above 1.3000 signals an end to a period of bearish consolidation and suggests the market is in the process of carving out a more significant longer-term base. Next key resistance now comes in up into the 1.4000 area. Setbacks should be very well supported down into the 1.3000 area.USDCAD – fundamental overview
Friday's Canada jobs report produced some very impressive, strong results, with a net change of +104k from 10.1k previous and just 5k expected. This was a major driver of Canadian Dollar outperformance. Key standouts on Monday’s calendar come from German industrial production, Eurozone unemployment, Canada building permits, and US consumer inflation expectations.NZDUSD – technical overview
Overall pressure remains on the downside with risk for the current recovery rally to stall out and form a lower top for the next major downside extension. A break back above 0.6577 would be required to take the immediate pressure off the downside.NZDUSD – fundamental overview
Despite gains against the US Dollar in recent sessions, the Kiwi rate has underperformed against its peers on the back of a sharp decline in housing data and fresh doubts about just how much the RBNZ will need to shift to a less hawkish policy stance. Key standouts on Monday’s calendar come from German industrial production, Eurozone unemployment, Canada building permits, and US consumer inflation expectations.US SPX 500 – technical overview
Longer-term technical studies are in the process of unwinding from extended readings off record highs. Look for rallies to be well capped in favor of lower tops and lower lows. A monthly close back above 4300 will be required at a minimum to take the immediate pressure off the downside. Next major support comes in at 3492.US SPX 500 – fundamental overview
We've finally reached a point in the cycle where the Fed recognizes unanchored inflation expectations pose a greater downside risk than over-tightening. This is significant, as it means less investor friendly monetary policy that risks potential recession in the months ahead. Overall, we expect inflation to continue to be a problem in H1 2023 that results in downside pressure into rallies.GOLD (SPOT) – technical overview
The 2019 breakout above the 2016 high at 1375 was a significant development, opening the door for fresh record highs. Setbacks should now be well supported above 1600 on a monthly close basis ahead of the next major upside extension. The recent break back above 1808 strengthens the bullish outlook.GOLD (SPOT) – fundamental overview
The yellow metal continues to be well supported on dips with solid demand from medium and longer-term accounts. These players are more concerned about inflation risk and a less upbeat global growth outlook. All of this should keep the commodity well supported, with many market participants also fleeing to the hard asset as the grand dichotomy of record high equities and record low yields comes to an unnerving climax.