


Next 24 hours: Risk appetite looking good
Today’s report: Back to taking comfort in the bad data
Investors are clearly happy to keep with the trend of looking for bad news to help pressure the Fed into more investor friendly monetary policy. This is playing out yet again after the latest batch of economic data out of the US.
Wake-up call
- EURUSDECB Lane thinking inflation returning to target
- Market pricing
- Japan holiday
- Mixed bag
- USDCAD Lower oil continues to weigh on Loonie
- modest growth
- inflation outlook
- Macro themes
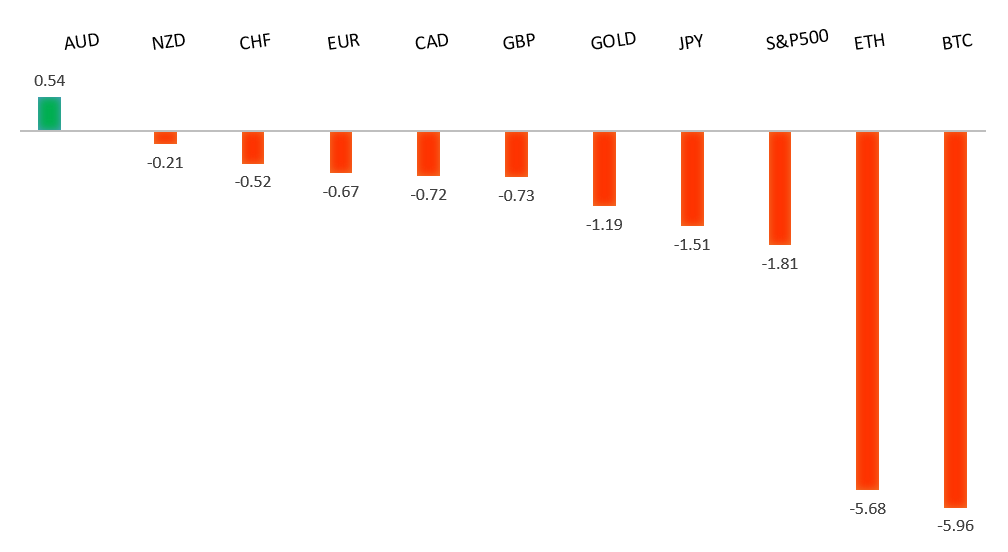
Peformance chart: 30-Day Performance vs. US dollar (%)
Suggested reading
- Inside The Biggest Investor In The World, M. Rubinstein, Net Interest (April 26, 2024)
- Interest Rates Don't Matter to Google and Microsoft, C. Sen, Bloomberg (May 3, 2024)
Chart talk: Technical & fundamental highlights
Choose pair:
EURUSD – technical overview
The Euro has been in a multi-month consolidation since bottoming out in 2022. Setbacks have since been exceptionally well supported on dips below 1.0500, with a higher platform sought out ahead of the next major upside extension. Look for a push through the 2023 high at 1.1276 to strengthen the constructive outlook and extend the recovery run towards 1.2000. Only back below 1.0400 negates.EURUSD – fundamental overview
The Euro has been getting a lot of help from broad based US Dollar outflows on account of Friday's softer US jobs report. We've also heard from ECB Lane who said recent Eurozone data may have made him more confident inflation is returning to target. Key standouts on Monday’s calendar come from German and Eurozone PMI reads, Eurozone producer prices, Canada wages, and some Fed speak.EURUSD - Technical charts in detail
GBPUSD – technical overview
Signs have emerged of the market wanting to put in a longer-term base after collapsing to a record low in September 2022. The latest push to a fresh 2024 high beyond 1.2830 confirms the outlook and opens the door for the next major upside extension towards the 2023 high at 1.3143. Any setbacks should now be well supported ahead of 1.2000.GBPUSD – fundamental overview
The latest rally in the Pound on the back of the softer US jobs data has run into resistance, with the currency underperforming as the market is now pricing a less hawkish BOE meeting later this week. Key standouts on Monday’s calendar come from German and Eurozone PMI reads, Eurozone producer prices, Canada wages, and some Fed speak.USDJPY – technical overview
The market remains confined to a strong uptrend, most recently extending to a multi-year high through 160.00. Key support comes in at 151.95, with only a weekly close below to delay the constructive outlook.USDJPY – fundamental overview
Japanese markets are closed for holiday and UK markets are also out for the May Day holiday. This sets the stage for thinner Monday conditions. Key standouts on Monday’s calendar come from German and Eurozone PMI reads, Eurozone producer prices, Canada wages, and some Fed speak.AUDUSD – technical overview
There are signs of the potential formation of a longer-term base with the market trading down into a meaningful longer-term support zone. Only a monthly close below 0.6200 would give reason for rethink. Back above 0.6900 will take the big picture pressure off the downside and strengthen case for a bottom.AUDUSD – fundamental overview
There's been a mixed bag of data out of Australian to start the week. Job ads turned back up into the green, inflation readings showed a continued moderation, and median weekly rent values across Australian dwellings hit a fresh record high. Key standouts on Monday’s calendar come from German and Eurozone PMI reads, Eurozone producer prices, Canada wages, and some Fed speak.USDCAD – technical overview
Above 1.3000 signals an end to a period of longer-term bearish consolidation and suggests the market is in the process of carving out a more significant longer-term base. Next key resistance now comes in up into the 1.4000 area. Setbacks should be very well supported down into the 1.3000 area.USDCAD – fundamental overview
The Canadian Dollar has been one of the weaker currencies of late on account of some softer Canada economic data and a downturn in the price of oil. We did however see an improvement in Friday's Canada PMI reads. Key standouts on Monday’s calendar come from German and Eurozone PMI reads, Eurozone producer prices, Canada wages, and some Fed speak.NZDUSD – technical overview
Overall pressure remains on the downside with the market continuing to stall out on runs up into the 0.6500 area. At the same time, there are some signs of the market wanting to put in a longer-term base. Ultimately, a break back above 0.6500 would be required to take the medium-term pressure off the downside and encourage this prospect. A monthly close below 0.5800 will intensify bearish price action.NZDUSD – fundamental overview
The OECD said the RBNZ has limited scope to cut rates this year and should not ease policy until there is clear evidence inflation will fall to the middle of the central bank's target range. Meanwhile, on the data front, the ANZ commodity price index saw modest growth in April. Key standouts on Monday’s calendar come from German and Eurozone PMI reads, Eurozone producer prices, Canada wages, and some Fed speak.US SPX 500 – technical overview
Longer-term technical studies continue to look quite extended after pushing to fresh record highs, begging for a deeper correction ahead. Look for rallies to be well capped in favor of lower tops and lower lows. Next key support comes in at 4921.US SPX 500 – fundamental overview
Though we have seen a healthy adjustment of investor expectations towards the amount of rate cuts in 2024, the market still hopes policy will end up erring more towards the investor friendly, accommodative side of things. This bet has kept stocks well bid into dips and consistently pushing record highs. The trouble right now is that inflation has been showing signs of ticking back up, all while the market contends with additional uncertainty around geopolitical risk.GOLD (SPOT) – technical overview
The 2019 breakout above the 2016 high at 1375 was a significant development, opening the door for fresh record highs. Setbacks should now be well supported above 1900 on a monthly close basis ahead of the next major upside extension towards 2500.GOLD (SPOT) – fundamental overview
The yellow metal has pushed record highs in 2024 with solid demand from medium and longer-term accounts. These players are more concerned about inflation, geopolitical risk and a less upbeat global growth outlook. All of this should keep the commodity well supported, with many market participants also fleeing to the hard asset as the grand dichotomy of record high equities and record low yields comes to an end.