


Next 24 hours: Things looking up as the new week gets going
Today’s report: Buy the dip or sell the rally?
We remain in the thick of thin summer trade, something that must be taken into consideration when reflecting on price action. The market has done a good job overall recovering from last Monday’s panic mess and the question on everyone’s mind is whether or not all of that doom and gloom is behind us or just the start to another intense wave of risk off flow.
Wake-up call
- wholesale prices
- Negative headwinds
- BOJ communication
- iron ore
- cut possibility
- RBNZ positioning
- Fed outlook
- Macro themes
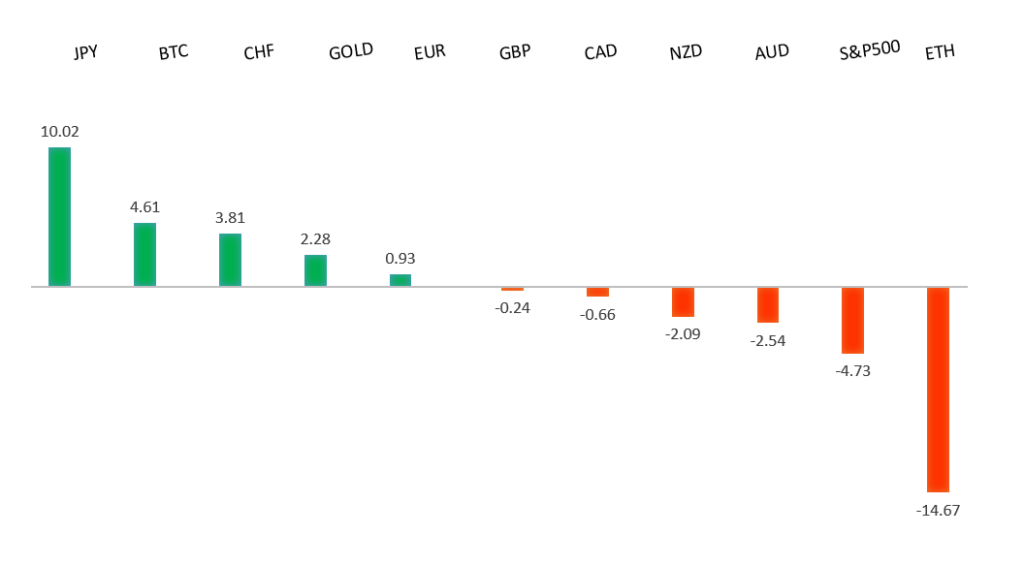
Peformance chart: 30-Day Performance vs. US dollar (%)
Suggested reading
- Buy The Dip? Or Embrace The Rotation?, L. Gave, Evergreen Gavekal (August 8, 2024)
- The U.S. Cities With the Most International Visitors, D. Moreno, Luxury Link (August 8, 2024)
Chart talk: Technical & fundamental highlights
Choose pair:
EURUSD – technical overview
The Euro has been in a multi-month consolidation since bottoming out in 2022. Setbacks have since been exceptionally well supported on dips below 1.0500, with a higher platform sought out ahead of the next major upside extension. Look for a push through the 2023 high at 1.1276 to strengthen the constructive outlook and extend the recovery run towards 1.2000. Only back below 1.0400 negates.EURUSD – fundamental overview
There hasn't been much movement in the Euro in recent sessions, though what little economic data we have seen of late has leaned to the softer side. On Friday, French wages declines despite the expected benefit from the Olympics. Key standouts on Monday’s calendar come from German wholesale prices, Canada building permits, US consumer inflation expectations, and the US monthly budget statement.EURUSD - Technical charts in detail
GBPUSD – technical overview
Signs have emerged of the market wanting to put in a longer-term base after collapsing to a record low in September 2022. The door is now open for the next major upside extension towards the 2023 high at 1.3143. Any setbacks should be well supported ahead of 1.2500.GBPUSD – fundamental overview
The Pound enjoyed a nice recovery into the end of last week, getting a boost from bigger picture risk on flow and broad based US Dollar selling. The market also seemed to be less worried about the social unrest in the UK, which helped to calm nerves and benefit the local currency. Key standouts on Monday’s calendar come from German wholesale prices, Canada building permits, US consumer inflation expectations, and the US monthly budget statement.USDJPY – technical overview
The market has entered a period of correction after extending the uptrend to a multi-year high through 160.00. Critical support comes in around 140.00, with only a monthly close below the barrier to compromise the bullish outlook. A higher low is ideally sought out over the coming sessions in favor of a bullish continuation.USDJPY – fundamental overview
Most of the renewed Yen weakness has come from last week's BOJ communication that the central bank won't be looking to move away from accommodative policy despite the recent rate hike. The Yen was further sold on a renewed wave of risk appetite. Key standouts on Monday’s calendar come from German wholesale prices, Canada building permits, US consumer inflation expectations, and the US monthly budget statement.AUDUSD – technical overview
There are signs of the potential formation of a longer-term base with the market trading down into a meaningful longer-term support zone. Only a monthly close below 0.6200 would give reason for rethink. Back above 0.6900 will take the big picture pressure off the downside and strengthen case for a bottom.AUDUSD – fundamental overview
The Australian Dollar recovery stalled out into some technical resistance, while traders were also thrown off by a front-month iron ore contract closing out at its lowest level since April. Key standouts on Monday’s calendar come from German wholesale prices, Canada building permits, US consumer inflation expectations, and the US monthly budget statement.USDCAD – technical overview
A sustained hold above 1.3000 over the past several months signals an end to a period of longer-term bearish consolidation and suggests the market is in the process of carving out a more significant longer-term base. Next key resistance now comes in up into the 1.4000 area, with a break to open a retest of the 2020 high just ahead of 1.4700. Setbacks should be very well supported down into the 1.3000 area.USDCAD – fundamental overview
The Canadian Dollar held up rather well on Friday despite the discouraging Canada employment report. The local rate market has now begun to price in the 10% possibility for an even bigger 50 basis point rate cut at the Bank of Canada's next meeting in early September. Key standouts on Monday’s calendar come from German wholesale prices, Canada building permits, US consumer inflation expectations, and the US monthly budget statement.NZDUSD – technical overview
Overall pressure remains on the downside with the market continuing to stall out on runs up into the 0.6500 area. At the same time, there are some signs of the market wanting to put in a longer-term base. Ultimately, a break back above 0.6500 would be required to take the medium-term pressure off the downside and encourage this prospect. A monthly close below 0.5800 will intensify bearish price action.NZDUSD – fundamental overview
The New Zealand Dollar has enjoyed a renewed wave of demand as investor risk appetite turns back up. At the same time, there has been concern from bulls on account of the latest cooling off in New Zealand inflation expectations, the slowest since Q1 2021. This puts market odds for a rate cut this week well above 50%. Key standouts on Monday’s calendar come from German wholesale prices, Canada building permits, US consumer inflation expectations, and the US monthly budget statement.US SPX 500 – technical overview
Longer-term technical studies are in the process of unwinding from overbought levels. There is now room for a pullback towards previous resistance turned support in the form of the previous record high from January 2022 at 4820 before the market considers a resumption of the bigger picture uptrend.US SPX 500 – fundamental overview
Though we have seen a healthy adjustment of investor expectations towards the amount of rate cuts in 2024, the market still hopes policy will end up erring more towards the investor friendly, accommodative side of things. This bet has kept stocks well bid into dips and consistently pushing record highs. Still, if there is a sense the Fed will need to be more sensitive towards erring on the side of higher rates, it could invite a much bigger disruption to stocks than what we've already seen.GOLD (SPOT) – technical overview
The 2019 breakout above the 2016 high at 1375 was a significant development, opening the door for fresh record highs and this next major upside extension into the 2500-3000 area. Setbacks should now be well supported above 2200 on a monthly close basis.GOLD (SPOT) – fundamental overview
The yellow metal has pushed record highs in 2024 with solid demand from medium and longer-term accounts. These players are more concerned about inflation, geopolitical risk and a less upbeat global growth outlook. All of this should keep the commodity well supported, with many market participants also fleeing to the hard asset as the grand dichotomy of record high equities and record low yields comes to an end.